Tag Archive for MySQL Cluster CGE

How can a database be in-memory and durable at the same time?

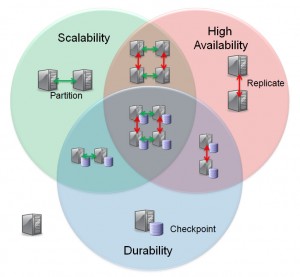
There is often confusion as to how it can be claimed that MySQL Cluster delivers in-memory performance while also providing durability (the “D” in ACID). This post explains how that can be achieved as well as how to mix and match scalability, High Availability and Durability.

MySQL Cluster deployment options

As an aside, the user can specify specific MySQL Cluster tables or columns to be stored on disk rather than in memory – this is a solution for extra capacity but you don’t need to take this performance hit just to have the data persisted to disk. This post focuses on the in-memory approach.

There is a great deal of flexibility in how you deploy MySQL Cluster with in-memory data – allowing the user to decide which features they want to make use of.

The simplest (and least common) topology is represented by the server sitting outside of the circles in the diagram. The data is held purely in memory in a single data node and so if power is lost then so is the data. This is an option if you’re looking for an alternative to the MEMORY storage engine (and should deliver better write performance as well as more functionality). To implement this, your configuration file would look something like this:

config.ini (no Durability, Scalability or HA)

[ndbd default]
NoOfReplicas=1
datadir=E:am233268DocumentsMySQL_ClusterMy_Clusterdata

[ndbd]
hostname=localhost

[ndb_mgmd]
hostname=localhost

[mysqld]
hostname=localhost

By setting NoOfReplicas to 1, you are indicating that data should not be duplicated on a second data node. By only having one [ndbd] section you are specifying that there should be only 1 data node.

To indicate that the data should not be persisted to disk, make the following change:

mysql> SET ndb_table_no_logging=1;

Once ndb_table_no_logging has been set to 1, any Cluster tables that are subsequently created will be purely in-memory (and hence the contents will be volatile).

Durability can be added as an option. In this case, the changes to the in-memory data is persisted to disk asynchronously (thus minimizing any increase in transaction latency). Persistent is implemented using 2 mechanisms in combination:

  • Periodically a snapshot of the in-memory data in the data node is written to disk – this is referred to as a Local Checkpoint (LCP)
  • Each change is written to a Redo log buffer and then periodically these buffers are flushed to a disk-based Redo log file – this is coordinated across all data nodes in the Cluster and is referred to as a Global Checkpoint (GCP)

This checkpointing to disk is enabled by default but if you’ve previously turned it off then you can turn it back on with:

mysql> SET ndb_table_no_logging=0;

Following this change, any new Cluster tables will be asynchronously persisted to disk. If you have existing, volatile MySQL Cluster tables then you can now make them persistent:

mysql> ALTER TABLE tab1 ENGINE=ndb;

High Availability can be implemented by including extra data node(s) in the Cluster and increasing the value of NoOfReplicas (2 is the normal value so that all data is held in 2 data nodes). The set (pair) of data nodes storing the same set of data is referred to as a node group. Data is synchronously replicated between the data nodes in the node group and so changes cannot be lost unless both data nodes fail at the same time. If the 2 data nodes making up a node group are run on different servers then the data can remain available for use even if one of the servers fails. The configuration file for single, 2 data node node group Cluster would look something like:

config.ini (HA but no scalability)

[ndbd default]
NoOfReplicas=2
datadir=E:am233268DocumentsMySQL_ClusterMy_Clusterdata
[ndbd]
hostname=192.168.0.1
[ndbd]
hostname=192.168.0.2
[ndb_mgmd]
hostname=192.168.0.3
[mysqld]
hostname=192.168.0.1
[mysqld]
hostname=192.168.0.2
If you exceed the capacity or performance of a single node group then you can add extra data node(s) to add 1 or more extra node groups. An example configuration where we want scalability but not High Availability would have multiple node groups but each made up of a single data node. The configuration file would look something like this:
config.ini (scalability but not HA)
[ndbd default]
NoOfReplicas=1
datadir=E:am233268DocumentsMySQL_ClusterMy_Clusterdata
[ndbd]
hostname=192.168.0.1
[ndbd]
hostname=192.168.0.2
[ndb_mgmd]
hostname=192.168.0.1
[mysqld]
hostname=192.168.0.1
[mysqld]
hostname=192.168.0.2
New node groups can be added to a Cluster without taking the database off-line (see MySQL Cluster 7.1 New Features White Paper).
As shown in the diagram at the start of this post it is also possible to implement any combination of Durability, Scalability and High Availability. A typical configuration that has scalability (in this case 2 node-groups), HA (2 data nodes in each node group) and durability (there by default) could be implemented with this configuration file:
config.ini (Scalability,  HA & Durability)
[ndbd default]
NoOfReplicas=2
datadir=E:am233268DocumentsMySQL_ClusterMy_Clusterdata
[ndbd]
hostname=192.168.0.1
[ndbd]
hostname=192.168.0.2
[ndbd]
hostname=192.168.0.3
[ndbd]
hostname=192.168.0.4
[ndb_mgmd]
hostname=192.168.0.5
[ndb_mgmd]
hostname=192.168.0.6
[mysqld]
hostname=192.168.0.5
[mysqld]
hostname=192.168.0.6
While that solution now provides you with scalability, durability and HA you are still vulnerable to the loss of the entire Cluster (for example, a catastrophic power failure for the whole data center) – to avoid this, asynchronous replication (Geo Replication) can be setup between 2 (or more) Clusters running at 2 different locations. There is no limit to the distance between the 2 sites. As with the nodal topology, Geo Replication can be used between Clusters deploying any combination of the features described here and there is no requirement for both sites to be using the same Cluster configuration (or even for the second site to store data in MySQL Cluster at all!). More details on Geo Replication scenarios can be found at http://www.clusterdb.com/mysql-cluster/setting-up-mysql-asynchronous-replication-for-high-availability/


Free webinar – Scaling web apps with MySQL (an alternative to the MEMORY storage engine)

Mat Keep and I will be presenting this free webinar on Wednesday 14 July.

The MEMORY storage engine has been widely adopted by MySQL users to provide near-instant responsiveness with use cases such as caching and web session management. As these services evolve to support more users, so the scalability and availability demands can start to exceed the capabilities of the MEMORY storage engine.

The MySQL Cluster database, which itself can be implemented as a MySQL storage engine, is a viable alternative to address these evolving web service demands. MySQL Cluster can be configured and run in the same way as the MEMORY storage engine (ie on a single host with no replication and no persistence). As web services evolve, any of these attributes can then be added in any combination to deliver higher levels of scalability, availability and database functionality, especially for those workloads which predominately access data by the primary key.

As always, the webinar is free of charge but you will need to register here.

Time:

  • Wed, Jul 14: 06:00 Hawaii time
  • Wed, Jul 14:  09:00 Pacific time (America)
  • Wed, Jul 14: 10:00 Mountain time (America)
  • Wed, Jul 14: 11:00 Central time (America)
  • Wed, Jul 14: 12:00 Eastern time (America)
  • Wed, Jul 14: 16:00 UTC
  • Wed, Jul 14: 17:00 Western European time
  • Wed, Jul 14: 18:00 Central European time
  • Wed, Jul 14: 19:00 Eastern European time

If you can’t make the live webinar then register anyway and you’ll get sent a link to the recording after the event.


MySQL Workbench 5.2 goes GA – partial support for MySQL Cluster

Configure MySQL Server nodes for MySQL Cluster

The new version of MySQL Workbench (5.2.25) has just gone GA – see the Workbench BLOG for details.

So what’s the relevance to MySQL Cluster? If you have a Cluster that uses MySQL Servers to provide SQL access then you can now use MySQL Workbench to manage those nodes:

  • Start & stop the mysqld processes
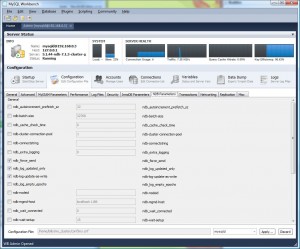
  • Configure the per-mysqld configuration data held in my.cnf or my.ini

The reason that I describe the support as ‘partial’ is that these MySQL Servers are treated as independent entities (no concept of them being part of a Cluster) and there is currently no way to use it to configure or manage the other Cluster processes (data and management nodes). Having said that, what is there provides a lot of value and Workbench is designed to be very extensible  and so hopefully there can be further MySQL Cluster support in the future.

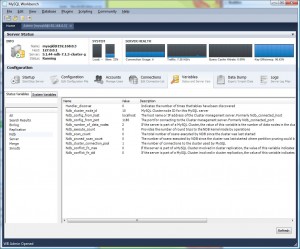
View MySQL Cluster status variables

In addition to MySQL Cluster-specific configuration parameters, you can also access the Cluster-specific status variables (these are the ones starting with ndb).

While I’ve focussed on what’s unique to MySQL Cluster, you can of course use the other Workbench features with MySQL Cluster – for example:

  • Creating (or reverse-engineering) your data model
  • Define your schema
  • View/write data to your tables
  • Create your SQL queries


Using Syslog with MySQL Cluster

By default, MySQL Cluster sends log data to a file but you can also send it to the console or to Syslog; this article explains how to send it to Syslog. The example given here is for LINUX.

In this example, I’ll use the “user” syslog facility name and so the first step is to make sure that syslog is configured to route those messages. If this hasn’t already been configured then add the following lines to /etc/rsyslog.conf:

# Log user messages to local files
user.*    /var/log/user

For the changes to take effect, restart the syslog service:

[root@ws1 etc]# service rsyslog restart
Shutting down system logger:                               [  OK  ]
Starting system logger:                                    [  OK  ]

Note that you should make those changes as root.

Still as root, start up a stream of  any additions to the new log file:

[root@ws1 etc]# tail -f /var/log/user

To tell Cluster to use Syslog, add this line into the [ndb_mgmd] section in config.ini:

LogDestination=SYSLOG:facility=user

and then start up your Cluster as normal.

You should now be able to see that MySQL Cluster information is being logged to /var/log/user.

You can adjust how much information is logged either through the config file or from the ndb_mgm tool, for example – to see when global checkpoints are written:

ndb_mgm> all clusterlog checkpoint=15
Executing CLUSTERLOG CHECKPOINT=15 on node 3 OK!
Executing CLUSTERLOG CHECKPOINT=15 on node 4 OK!
Note that a log-level of 15 will show all logs and 0 will show none. Other log categories besides CHECKPOINT are STARTUP, SHUTDOWN, STATISTICS, NODERESTART, CONNECTION, INFO, ERROR, CONGESTION, DEBUG and BACKUP.


MySQL Cluster presentation at Oracle Open World 2010

As part of “MySQL Sunday” at this year’s Oracle Open World, Mat Keep and I will be presenting on the latest MySQL Cluster features. We’ll be presenting at 15:30 (Pacific Time) on 19th September (the event starts with a key note at 12:30).

If you’re attending Oracle Open World then please indicate that you’d like to attend the MySQL Sunday when you register. If you aren’t planning to go to Oracle Open World but will be in the San Francisco area then buying a Discover pass (only $50 if you register by 16 July) will get you into the MySQL Sunday sessions. Register here.

For details on the presentations and speakers, check here.


Breakfast seminar on what’s new with MySQL – London

If you’re in London on Thursday 24th June then there’s a great chance to find out what’s new in MySQL.

Join us for an Oracle MySQL Breakfast Seminar to better understand Oracle’s MySQL strategy and what’s new with MySQL!
Agenda:
09:00 a.m.    Welcome Coffee/Tea
09:30 a.m.    Oracle’s MySQL Strategy
10:00 a.m.    What’s New – The MySQL Server & MySQL Cluster
10.45 a.m.    Coffee/Tea Break
11:00 a.m.    What’s New – MySQL Enterprise & MySQL Workbench
11:45 a.m.    Q&A
12:00 noon    End of the Breakfast Seminar

Cost?
None, it’s a free event! But places are limited and the seminar is held on a first come first served basis, so register quickly!

Location:

Sun Microsystem’s Customer Briefing Center
Regis House
45 King William Street
London EC4R 9AN
Tel: (020) 7628 3000

Image courtesy of Anirudh Koul.

Join us for an Oracle MySQL Breakfast Seminar in London, Thursday June 24th 2010, to better understand Oracle’s MySQL strategy and what’s new with MySQL!

Agenda:
09:00 a.m. Welcome Coffee/Tea
09:30 a.m. Oracle’s MySQL Strategy
10:00 a.m. What’s New – The MySQL Server & MySQL Cluster
10.45 a.m. Coffee/Tea Break
11:00 a.m. What’s New – MySQL Enterprise & MyQL Workbench
11:45 a.m. Q&A
12:00 noon End of the Breakfast Seminar

* Agenda subject to change

Cost?
None, it’s a free event! But places are limited and the seminar is held on a first come first served basis, so register quickly!


Scaling Web Services with MySQL Cluster: An Alternative Approach to MySQL & memcached

A new white paper is available from http://www.mysql.com/why-mysql/white-papers/mysql_wp_cluster_ScalingWebServices.php

MySQL and memcached has become, and will remain, the foundation for many dynamic web services with proven deployments in some of the largest and most prolific names on the web.

There are classes of web services however that are highly transactional and update-intensive, demanding real-time responsiveness and continuous availability. In these cases, MySQL Cluster provides the familiarity and ease-of-use of the regular MySQL Server, while delivering significantly higher levels of write performance with less complexity, lower latency and 99.999% availability.

This whitepaper will discuss the use-cases for both approaches, and provides an insight into how MySQL Cluster is enabling users to scale update-intensive web services.

Scaling Web Services with MySQL Cluster: An Alternative Approach to MySQL & memcached


MySQL Cluster Powers Leading Document Management Web Service

A new customer case-study is available for download from http://www.mysql.com/why-mysql/case-studies/mysql_cs-cluster_docudesk_WebServices.php

The DocQ web service eliminates the limitations of sharing physical documents by offering a complete paperless business solution; providing a single place where customers can manage, archive, and send their important documents. DocQ supports secure business transactions and the services to store, edit, collaborate, and publish business documents.

  • The database needed to deliver the high levels of write throughput, low latency responsiveness and continuous availability demanded by the service
  • A sharded, multi-master MySQL solution with memcached was rejected due to the complexity of integration and management
  • MySQL Cluster was selected as it met all of the requirements of the service with one, integrated solution out of the box
  • MySQL Cluster is handling on average 1 million queries per day across both in-memory and disk-based tables, with the database growing at up to 2% daily
  • MySQL Cluster handles document metadata and text, PHP session state, ACLs, job queues and tracking of document actions for billing


Configure MySQL Enterprise Monitor to monitor MySQL Cluster

MySQL Cluster 7.1 introduced the ndbinfo database which contains views giving real-time access to a whole host of information that helps you monitor and tune your MySQL Cluster deployment. Because this data can be accessed through regular SQL, various systems can be configured to monitor the Cluster. This post gives one example, extending MySQL Enterprise Monitor to keep an eye on the amount of free memory on the data nodes (through a graph) and then raise an alarm when it starts to run low – even generating SNMP traps if that’s what you need.

One of the features of MySQL Enterprise Monitor is that you can define custom data collectors and that those data collectors can run SQL queries to get the data. The information retrieved by those custom data collectors can then be used with rules that the user defines through the MySQL Enterprise Monitor GUI to create warning/alarms.

In this example, I create two new data collectors in the file”<MySQL Enterprise Monitor installation directory>/agent/share/mysql-proxy/items/cluster.xml” before starting up the MySQL Enterprise Monitor agent (note that these should be created for the agent of each MySQL Server in the Cluster that you would like to use to present the information from the data nodes):

cluster.xml:

<?xml version="1.0" encoding="utf-8"?>
<classes>
  <class>
    <namespace>mysql</namespace>
    <classname>cluster_max_used</classname>
    <query><![CDATA[SELECT MAX(used) AS Used FROM ndbinfo.memoryusage WHERE memory_type = 'Data Memory';]]></query>
  </class>
  <class>
    <namespace>mysql</namespace>
    <classname>cluster_min_avail</classname>
    <query><![CDATA[SELECT MIN(total) AS Total FROM ndbinfo.memoryusage WHERE memory_type = 'Data Memory';]]></query>
  </class>
</classes>

So that the agent picks up this file, it should be referenced within <MySQL Enterprise Monitor installation directory>/agent/mysql-monitor-agent.ini:

agent-item-files = share/mysql-monitor-agent/items/quan.lua,share/mysql-monitor-agent/items/items-mysql-monitor.xml,
share/mysql-monitor-agent/items/custom.xml,share/mysql-monitor-agent/items/cluster.xml

In MySQL Enterprise Monitor, events are raised by rules. Rules are grouped together into Advisors and so I create a new Advisor called “MySQL Cluster” and then create just one new rule within that Advisor group.

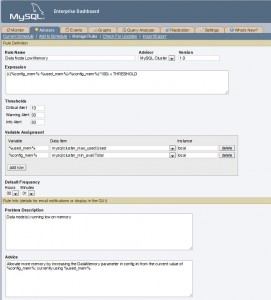
As shown in Fig. 1 the rule is called “Data Node Low Memory”. The “Variable Assignment” section is used to define 2 variables %used_mem% and %config_mem% which are populated from the Used and Total results from the 2 new data collectors. The “Expression” section is used to test “((Total Used)/Total)x100< THRESHOLD” and then the values to be substituted for THRESHOLD are defined in the “Thresholds” section – indicating at what points the Info, Warning and Critical Alters should be raised.

There are then a number of optional sections that you can use to add useful information to the person investigating the alert.

Once the rule has been created, the next step is to schedule and (if desired) tag that the alerts should also result in SNMP traps being raised. This is standard MySQL Enterprise Monitor practice and so it isn’t explained here except to point out that this rule is monitoring information from the data nodes but the rule has to be applied to a MySQL Server in the Cluster (MySQL Enterprise Monitor has no idea what a data node is) and so you need to schedule the rule against one or more arbitrary MySQL Server instances in the Cluster).

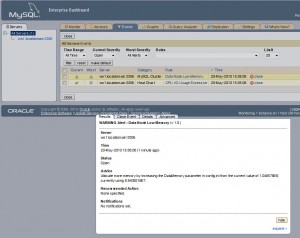
Fig. 2 Warning alert

To test the functionality, start adding more data to your MySQL Cluster until the Warning alert is triggered as shown in Fig. 2. As you can see, the optional information we included is shown – including values from Used and Total.


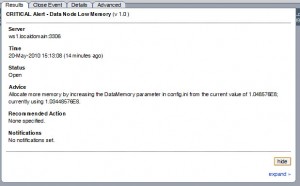
Fig. 3 Major alert

I then add more data to the database until the critical alert is raised and confirm that it’s displayed on the main monitoring panel of the MySQL Enterprise Monitor dashboard. Note that if you requested these alerts be included with the SNMP feed then SNMP traps will also be raised.

Please note that this example is intended to illustrate the mechanics of setting up monitoring on an arbitrary piece of data from ndbinfo and obviously in the real world you would want to monitor more than just the memory and even for the memory, you might want to use a more sophisticated rule.

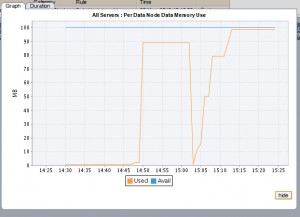
Fig. 4 Custom graph for memory usage


It is sometimes more useful to see how a value changes over time. For this, MySQL Enterprise Monitor provides graphs. The data collectors created for the rule can also be used to add a new graph to Enterprise monitor. The graph is defined by creating the following file:

<com_mysql_merlin_server_graph_Design>
  <version>1.0</version>
  <uuid>b0bc2bba-ea9b-102b-b396-94aca32b0b28</uuid>
  <tag></tag>
  <name>Per Data Node Data Memory Use</name>
  <rangeLabel>MB</rangeLabel> <frequency>00:01:00</frequency>
  <series>
    <label>Used</label>
    <expression>cluster_data_node_used_data_memory/1024/1024</expression>
  </series>
  <series>
    <label>Avail</label>
    <expression>cluster_data_node_config_data_memory/1024/1024</expression>
  </series>
  <variables>
    <name>cluster_data_node_used_data_memory</name>
    <dcItem>
      <nameSpace>mysql</nameSpace>
      <className>cluster_max_used</className>
      <attribName>Used</attribName>
    </dcItem>
    <instance>local</instance>
  </variables>
  <variables>
    <name>cluster_data_node_config_data_memory</name>
    <dcItem>
      <nameSpace>mysql</nameSpace>
      <className>cluster_min_avail</className>
      <attribName>Total</attribName>
    </dcItem>
    <instance>local</instance>
  </variables>
</com_mysql_merlin_server_graph_Design>
 

Fig. 5 MySQL Enterprise Monitor dashboard

Click on Import/Export in the Graphs tab in Enterprise Monitor (2.2) and then import the file defining the graph.

The graph will then appear on the graphs tab and can also be configured to appear on the main dashboard as shown in Fig. 5


Presenting Cluster tutorial at MySQL UC (and discount code!)

Together with Geert and Andrew I’ll be teaching the MySQL Cluster tutrial at this year’s MySQL Cluster User Conference – Santa Clara, on April 12th. If you’re interested in using MySQL Cluster but aren’t sure how to get started (or you’ve used it but would like some tips) then this is a great opportunity. Check out the tutorial description.

If you register by 15 March then you get the early-bird price and if you use this ‘friend of a speaker’ code then you get an additional 25% off: mys10fsp

mys10fsp