Tag Archive for MySQL Cluster 7.4

MySQL Cluster 7.4 New Features Webinar Replay

MySQL Cluster 7.4 GAI recently hosted a webinar introducing MySQL Cluster and then looking into what’s new in the latest version (MySQL Cluster 7.4) in some more detail. The replay of the MySQL Cluster 7.4 webinar is now available here. Alternatively if just want to skim through the charts then scroll down.

Abstract

MySQL Cluster powers the subscriber databases of major communication services providers as well as next generation web, cloud, social and mobile applications. It is designed to deliver:

  • Real-time, in-memory performance for both OLTP and analytics workloads
  • Linear scale-out for both reads and writes
  • 99.999% High Availability
  • Transparent, cross-shard transactions and joins
  • Update-Anywhere Geographic replication
  • SQL or native NoSQL APIs
  • All that while still providing full ACID transactions.

Understand some of the highlights of MySQL Cluster 7.4:

  • 200 Million queries per minute
  • Active-Active geographic replication with conflict detection and resolution
  • 5x faster on-line maintenance activities
  • Enhanced reporting for memory and database operations

Charts

Questions and Answers

  • Can all data be stored on disk rather than in memory? Any column that isn’t part of an index can be stored on disk if you want it to be. There is then an in-memory cache for the disk-based data.
  • Is in-memory data safe from the whole system shutting down (e.g. power loss for the whole data center)? The in-memory data is (asynchronously) checkpointed to disk (so that there is persistence but latency isn’t impacted).
  • I need to store more than 14K non BLOB/TEXT data in a single row – has this been addressed? As you say the options are to use TEXT/BLOB columns (or of course to split the data over multiple rows).
  • Can you comment on improvements of virtualized deploymets regarding the 7.4 version? Only to say that more and more people are deploying on VMs and we’re not seeing issues caused – if we do then they’ll be fixed
  • Can I upgrage from the previous version (7.3) to MySQL Cluster 7.4 or do I have to reinstall the product of the new version (7.4)? You can perform a rolling upgarade from MySQL Cluster 7.3 to MySQL Cluster 7.4 – the database stays uo throughout the process and you don’t lose any data or have to stop writing changes.


MySQL Cluster 7.4.6 is now available

MySQL Cluster Logo

The binary and source versions of MySQL Cluster 7.4.6 have now been made available at http://www.mysql.com/downloads/cluster/.

MySQL Cluster NDB 7.4.6 is a new maintenance release of MySQL Cluster, based on MySQL Server 5.6 and including features from version 7.4 of the NDB storage engine, as well as fixing a number of recently discovered bugs in previous MySQL Cluster releases.

This release also incorporates all bugfixes and changes made in previous MySQL Cluster releases, as well as all bugfixes and feature changes which were added in mainline MySQL 5.6 through MySQL 5.6.24.

The MySQL Cluster 7.4.6 Release Notes are available here.


MySQL Cluster 7.4 New Features – upcoming webinar

MySQL Cluster 7.4 GAOn Thursday I’ll be hosting a webinar introducing MySQL Cluster and then looking into what’s new in the latest version (MySQL Cluster 7.4) in some more detail. As always the webinar is free but please register here. I’ll be answering on-line Q&A during the presentation.

Even if you can’t join the live webinar, it’s worth registering as you’ll be emailed a link to the replay as soon as it’s available.

Abstract

MySQL Cluster powers the subscriber databases of major communication services providers as well as next generation web, cloud, social and mobile applications. It is designed to deliver:

  • Real-time, in-memory performance for both OLTP and analytics workloads
  • Linear scale-out for both reads and writes
  • 99.999% High Availability
  • Transparent, cross-shard transactions and joins
  • Update-Anywhere Geographic replication
  • SQL or native NoSQL APIs
  • All that while still providing full ACID transactions.

Understand some of the highlights of MySQL Cluster 7.4:

  • 200 Million queries per minute
  • Active-Active geographic replication with conflict detection and resolution
  • 5x faster on-line maintenance activities
  • Enhanced reporting for memory and database operations

When

  • Thu, Apr 09: 09:00 Pacific time (America)
  • Thu, Apr 09: 10:00 Mountain time (America)
  • Thu, Apr 09: 11:00 Central time (America)
  • Thu, Apr 09: 12:00 Eastern time (America)
  • Thu, Apr 09: 13:00 São Paulo time
  • Thu, Apr 09: 16:00 UTC
  • Thu, Apr 09: 17:00 Western European time
  • Thu, Apr 09: 18:00 Central European time
  • Thu, Apr 09: 19:00 Eastern European time
  • Thu, Apr 09: 21:30 India, Sri Lanka
  • Fri, Apr 10: 00:00 Singapore/Malaysia/Philippines time
  • Fri, Apr 10: 00:00 China time
  • Fri, Apr 10: 01:00 日本
  • Fri, Apr 10: 02:00 NSW, ACT, Victoria, Tasmania (Australia)


Upcoming webinar – SQL & NoSQL – the best of both worlds

MySQL Cluster LogoOn Thursday I’ll be hosting a webinar explaining how you can get the best from the NoSQL world while still getting all of the benefits of a proven RDBMS. As always the webinar is free but please register here.

Even if you can’t join the live webinar, it’s worth registering as you’ll be emailed a link to the replay as soon as it’s available.

Abstract

There’s a lot of excitement about NoSQL data stores, with the promise of simple access patterns, flexible schemas, scalability, and high availability. The downside comes in the form of losing ACID transactions, consistency, flexible queries, and data integrity checks. What if you could have the best of both worlds? Join this webinar to learn how MySQL Cluster provides simultaneous SQL and native NoSQL access to your data—whether it’s in a simple key-value API (memcached) or REST, JavaScript, Java, or C++. You will hear how the MySQL Cluster architecture delivers in-memory real-time performance; 99.999 percent availability; online maintenance; and linear, horizontal scalability through transparent autosharding.

When

  • Thu, Mar 26: 09:00 Pacific time (America)
  • Thu, Mar 26: 10:00 Mountain time (America)
  • Thu, Mar 26: 11:00 Central time (America)
  • Thu, Mar 26: 12:00 Eastern time (America)
  • Thu, Mar 26: 13:00 São Paulo time
  • Thu, Mar 26: 16:00 UTC
  • Thu, Mar 26: 16:00 Western European time
  • Thu, Mar 26: 17:00 Central European time
  • Thu, Mar 26: 18:00 Eastern European time
  • Thu, Mar 26: 21:30 India, Sri Lanka
  • Fri, Mar 27: 00:00 Singapore/Malaysia/Philippines time
  • Fri, Mar 27: 00:00 China time
  • Fri, Mar 27: 01:00 日本
  • Fri, Mar 27: 03:00 NSW, ACT, Victoria, Tasmania (Australia)


MySQL Cluster 7.4.5 Released

MySQL Cluster Logo

The binary and source versions of MySQL Cluster 7.4.5 have now been made available at http://www.mysql.com/downloads/cluster/.

Release notes

MySQL Cluster NDB 7.4.5 is a new maintenance release of MySQL Cluster, based on MySQL Server 5.6 and including features from version 7.4 of the NDB storage engine, as well as fixing a number of recently discovered bugs in previous MySQL Cluster releases.

This release also incorporates all bugfixes and changes made in previous MySQL Cluster releases, as well as all bugfixes and feature changes which were added in mainline MySQL 5.6 through MySQL 5.6.23.

Bugs Fixed

  • It was found during testing that problems could arise when the
    node registered as the arbitrator disconnected or failed during
    the arbitration process.

    In this situation, the node requesting arbitration could never
    receive a positive acknowledgement from the registered
    arbitrator; this node also lacked a stable set of members and
    could not initiate selection of a new arbitrator.

    Now in such cases, when the arbitrator fails or loses contact
    during arbitration, the requesting node immediately fails rather
    than waiting to time out.
    (Bug #20538179)

  • DROP DATABASE failed to remove
    the database when the database directory contained a
    .ndb file which had no corresponding table
    in NDB. Now, when executing
    DROP DATABASE, NDB
    performs an check specifically for leftover
    .ndb files, and deletes any that it finds.
    (Bug #20480035)

    References: See also Bug #44529.

  • The maximum failure time calculation used to ensure that normal
    node failure handling mechanisms are given time to handle
    survivable cluster failures (before global checkpoint watchdog
    mechanisms start to kill nodes due to GCP delays) was
    excessively conservative, and neglected to consider that there
    can be at most number_of_data_nodes /
    NoOfReplicas node
    failures before the cluster can no longer survive. Now the value
    of NoOfReplicas is properly taken into
    account when performing this calculation.
    (Bug #20069617, Bug #20069624)

    References: See also Bug #19858151, Bug #20128256, Bug #20135976.

  • During a node restart, if there was no global checkpoint
    completed between the START_LCP_REQ for a
    local checkpoint and its LCP_COMPLETE_REP it
    was possible for a comparison of the LCP ID sent in the
    LCP_COMPLETE_REP signal with the internal
    value SYSFILE->latestLCP_ID to fail.
    (Bug #76113, Bug #20631645)

  • When sending LCP_FRAG_ORD signals as part of
    master takeover, it is possible that the master not is not
    synchronized with complete accuracy in real time, so that some
    signals must be dropped. During this time, the master can send a
    LCP_FRAG_ORD signal with its
    lastFragmentFlag set even after the local
    checkpoint has been completed. This enhancement causes this flag
    to persist until the statrt of the next local checkpoint, which
    causes these signals to be dropped as well.

    This change affects ndbd only; the issue
    described did not occur with ndbmtd.
    (Bug #75964, Bug #20567730)

  • When reading and copying transporter short signal data, it was
    possible for the data to be copied back to the same signal with
    overlapping memory.
    (Bug #75930, Bug #20553247)

  • NDB node takeover code made the assumption that there would be
    only one takeover record when starting a takeover, based on the
    further assumption that the master node could never perform
    copying of fragments. However, this is not the case in a system
    restart, where a master node can have stale data and so need to
    perform such copying to bring itself up to date.
    (Bug #75919, Bug #20546899)

  • Cluster API:
    A scan operation, whether it is a single table scan or a query
    scan used by a pushed join, stores the result set in a buffer.
    This maximum size of this buffer is calculated and preallocated
    before the scan operation is started. This buffer may consume a
    considerable amount of memory; in some cases we observed a 2 GB
    buffer footprint in tests that executed 100 parallel scans with
    2 single-threaded (ndbd) data nodes. This
    memory consumption was found to scale linearly with additional
    fragments.

    A number of root causes, listed here, were discovered that led
    to this problem:

    • Result rows were unpacked to full
      NdbRecord format before
      they were stored in the buffer. If only some but not all
      columns of a table were selected, the buffer contained empty
      space (essentially wasted).

    • Due to the buffer format being unpacked,
      VARCHAR and
      VARBINARY columns always had
      to be allocated for the maximum size defined for such
      columns.

    • BatchByteSize and
      MaxScanBatchSize
      values were not taken into consideration as a limiting
      factor when calculating the maximum buffer size.

    These issues became more evident in NDB 7.2 and later MySQL
    Cluster release series. This was due to the fact buffer size is
    scaled by BatchSize, and
    that the default value for this parameter was increased fourfold
    (from 64 to 256) beginning with MySQL Cluster NDB 7.2.1.

    This fix causes result rows to be buffered using the packed
    format instead of the unpacked format; a buffered scan result
    row is now not unpacked until it becomes the current row. In
    addition, BatchByteSize and
    MaxScanBatchSize are now used as limiting
    factors when calculating the required buffer size.

    Also as part of this fix, refactoring has been done to separate
    handling of buffered (packed) from handling of unbuffered result
    sets, and to remove code that had been unused since NDB 7.0 or
    earlier. The NdbRecord class declaration has
    also been cleaned up by removing a number of unused or redundant
    member variables.
    (Bug #73781, Bug #75599, Bug #19631350, Bug #20408733)


MySQL Cluster 7.4 is GA!

MySQL Cluster 7.4 GA banner

The General Availability of MySQL Cluster 7.4 has just been announced by Oracle.

The MySQL team at Oracle are excited to announce the General Availability of MySQL Cluster 7.4, ready for production workloads.

MySQL Cluster 7.4.4 can be downloaded from mysql.com and the release notes viewed in the MySQL docs.

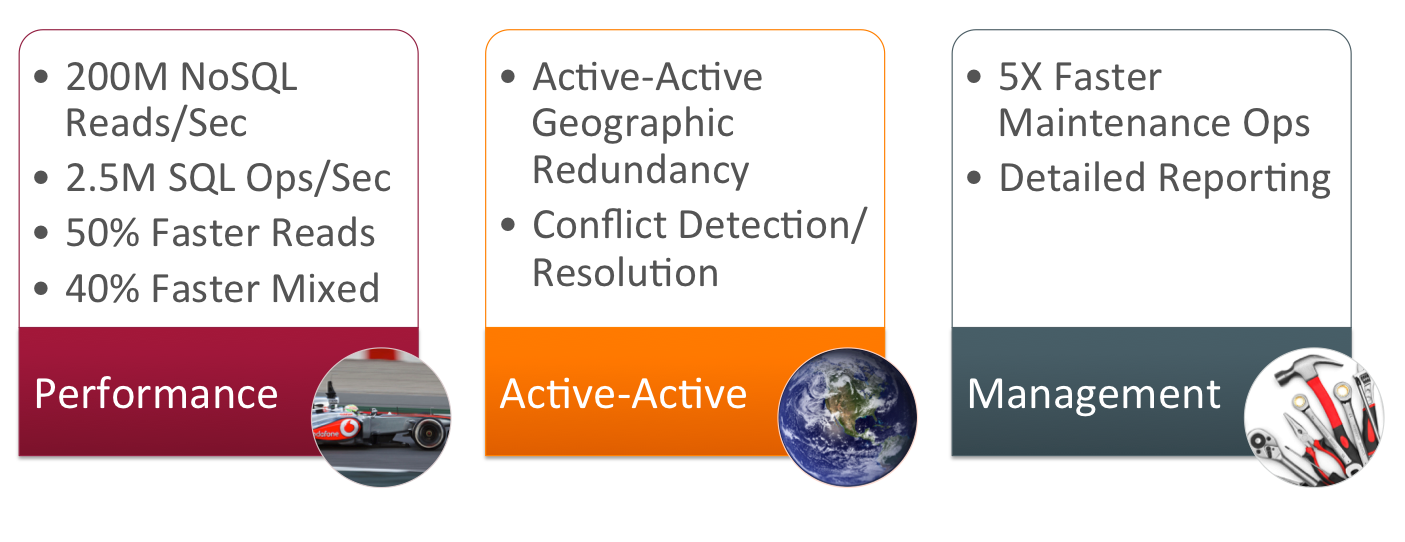
Figure 1 provides a summary of the enhancements delivered in this release:

  • Performance
    • 200M NoSQL Reads/Sec
    • 2.5M SQL Ops/Sec
    • 50% Faster Reads
    • 40% Faster Mixed
  • Active-Active
    • Active-Active Geographic Redundancy
    • Conflict Detection/Resolution
  • Management
    • 5X Faster Maintenance Ops
    • Detailed Reporting
MySQL Cluster 7.4 content summary

Figure 1: MySQL Cluster 7.4 content summary

The sections that follow delve into some more details.

Performance

MySQL CLuster 7.4.1 Read-Write Performance

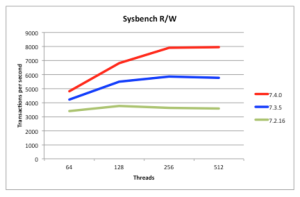
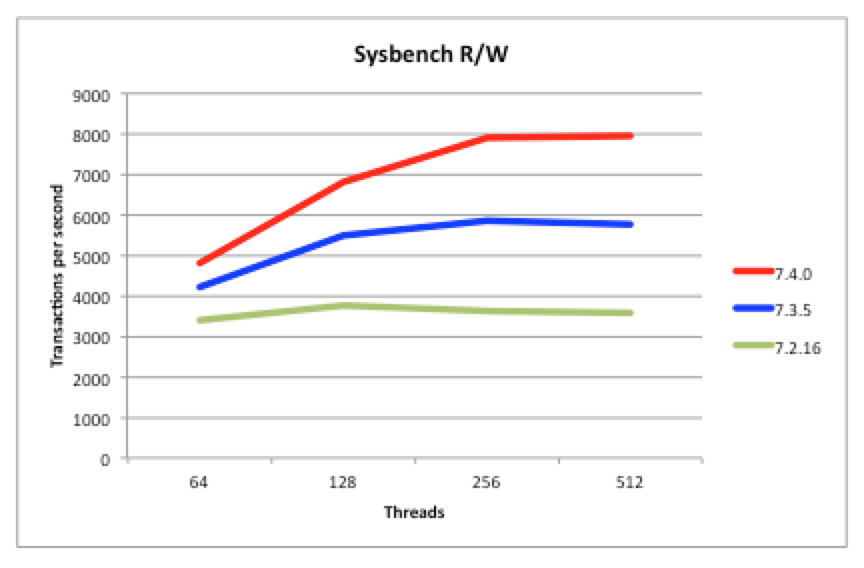
Figure 2: Read/Writes 40% Faster than MySQL Cluster 7.3

MySQL CLuster 7.4 Read Performance

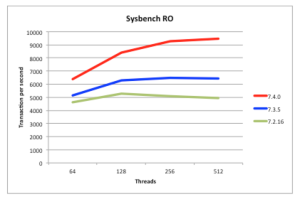
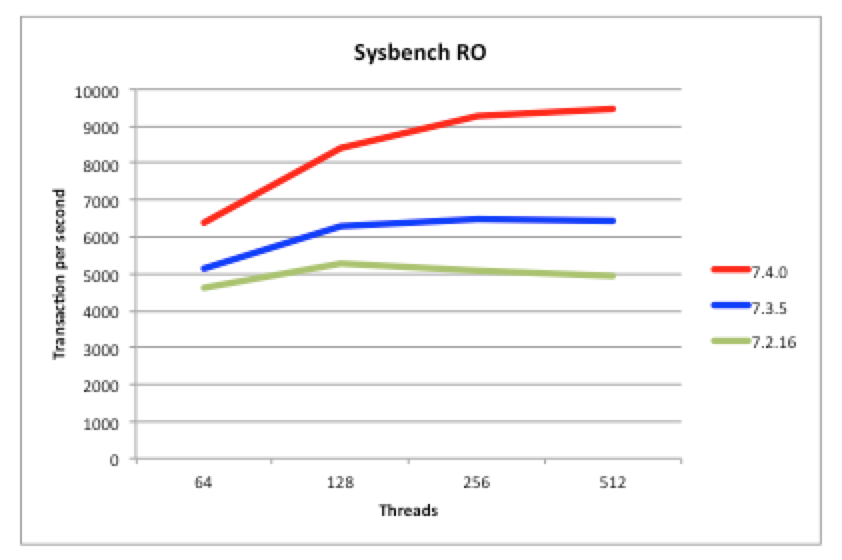
Figure 3: Reads 50% Faster than MySQL Cluster 7.3

50% Faster Reads than MySQL Cluster 7.3

Being a scaled-out, in-memory, real-time database, MySQL Cluster performance has always been great but we continue to work on making it faster each release. In particular, we want to keep pace with the trend of having more and more cores rather than faster ones. 7.4 continues along the path of better exploiting multiple cores – as can be seen from these benchmark results:

  • Figure 3 shows that for reads, MySQL Cluster 7.4 is 50% faster than last release
  • Figure 2 shows that for mixed traffic, MySQL Cluster 7.4 is 50% faster than last release

Just make sure that you’re using the multi-threaded data node (ndbmtd rather than ndbd) and have configured how many threads it should use.

The tests were performed using a 48 core/96 thread machine (also demonstrating how well MySQL Cluster can now scale up with large numbers of cores).

So, the sysbench benchmark results show how much faster MySQL Cluster 7.4 is compared to the previous 2 releases (a nice apples-to-apples test but on a very small cluster without any scale-out) but we now have some even more interesting benchmark results showing just how well MySQL Cluster can scale out to deliver incredible results…

200 Million NoSQL NoSQL QPS!

200 Million NoSQL Queries Per Second with MySQL Cluster 7.4

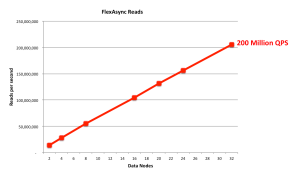
Figure 4: 200 Million NoSQL Queries Per Second

Using the flexAsynch benchmark tool and a pool of 32 data nodes (with each data node running on a dedicated 56 thread Intel E5-2697 v3 (Haswell) machine) the cluster was able to process 200,000,000 reads per second. These results are shown in Figure 4, where the number of data nodes are scaled on the x-axis – as you’ll observe, performance scales virtually linearly with the number of data nodes. Note that MySQL Cluster supports up to 48 data nodes and so there’s still plenty of scope to scale out even further.

2.5 Million SQL Operation per Second

2.5 Million SQL operations per second with MySQL Cluster

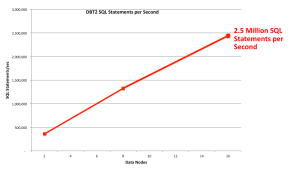
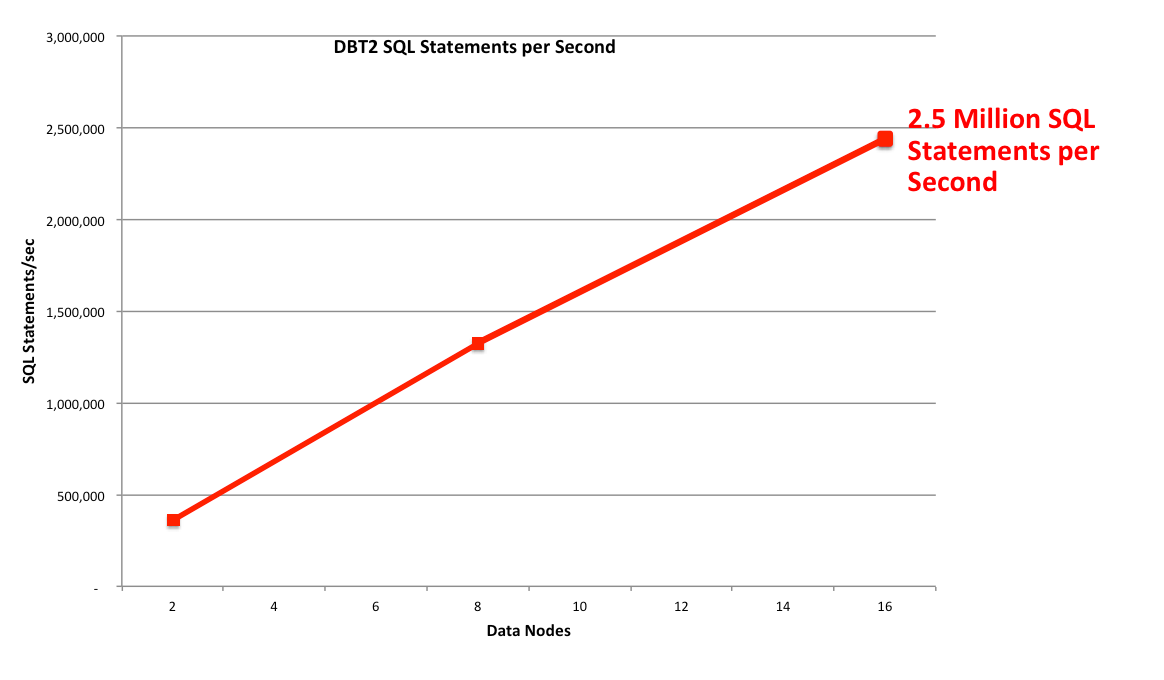
Figure 5: 2.5 Million SQL operations per second

Using a smaller cluster (just 16 data nodes running on the same 56 thread machines), the DBT2 Benchmark has been used to assess how well SQL performance scales as more data nodes are added. SQL performance was measured at 2,500,000 SQL read opeations per minute. This equates to around 5 Million Transactions Per Minutes or 2.2 Million NewOnly TPM.

As can be in Figure 5 the scaling of SQL reads is again almost linear.

Active-Active (Multi-Master) Replication

MySQL Cluster allows bi-directional replication between two (or more) clusters. Replication within each cluster is synchronous but between clusters it is asynchronous which means the following scenario is possible:

Conflict with asynchronous replication
Site A Replication Site B
x == 10 x == 10
x = 11 x = 20
— x=11 –> x == 11
x==20 <– x=20 —


In this example a value (column for a row in a table) is set to 11 on site A and the change is queued for replication to site B. In the mean time, an application sets the value to 20 on site B and that change is queued for replication to site A. Once both sites have received and applied the replicated change from the other cluster site A contains the value 20 while site B contains 11 – in other words the databases are now inconsistent.

How MySQL Cluster implements eventual consistency

There are two phases to establishing consistency between both clusters after an inconsistency has been introduced:

  1. Detect that a conflict has happened
  2. Resolve the inconsistency

The following animation illustrates how MySQL Cluster 7.2 detects that an inconsistency has been introduced by the asynchronous, active-active replication:

Figure 6: Detecting conflicts

While we typically consider the 2 clusters in an active-active replication configuration to be peers, in this case we designate one to be the primary and the other the secondary. Reads and writes can still be sent to either cluster but it is the responsibility of the primary to identify that a conflict has arisen and then remove the inconsistency.

A logical clock is used to identify (in relative terms) when a change is made on the primary – for those who know something of the MySQL Cluster internals, we use the index of the Global Checkpoint that the update is contained in. For all tables that have this feature turned on, an extra, hidden column is automatically added on the primary – this represents the value of the logical clock when the change was made.

Once the change has been applied on the primary, there is a “window of conflict” for the effected row(s) during which if a different change is made to the same row(s) on the secondary then there will be an inconsistency. Once the slave on the secondary has applied the change from the primary, it will send a replication event back to the slave on the primary, containing the primary’s clock value associated with the changes that have just been applied on the secondary. (Remember that the clock is actually the Global Checkpoint Index and so this feature is sometimes referred to as Reflected GCI). Once the slave on the primary has received this event, it knows that all changes tagged with a clock value no later than the reflected GCI are now safe – the window of conflict has closed.

If an application modifies this same row on the secondary before the replication event from the primary was applied then it will send an associated replication event to the slave on the primary before it reflects the new GCI. The slave on the primary will process this replication event and compare the clock value recorded with the effected rows with the latest reflected GCI; as the clock value for the conflicting row is higher the primary recognises that a conflict has occured and will launch the algorithm to resolve the inconsistency.

Options for MySQL Cluster replication conflict detection/resolution

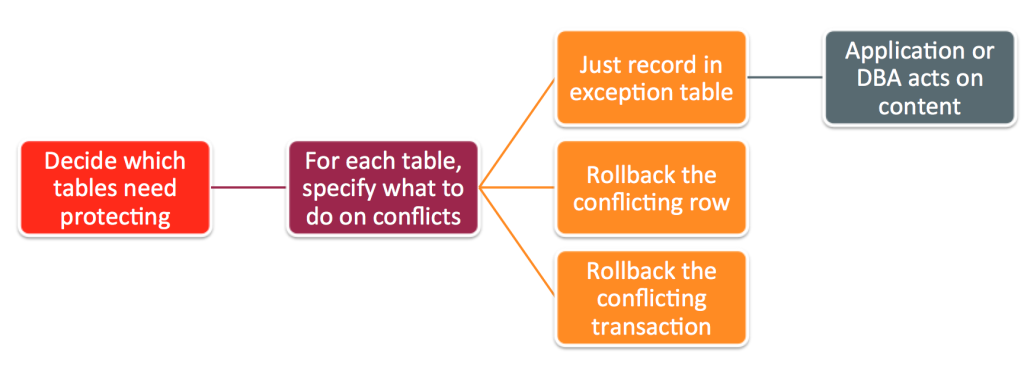
Figure 7: Options for MySQL Cluster replication conflict detection/resolution


After a conflict has been detected, you have the option of having the database simply report the conflict to the application or have it roll back just the conflicting row or the entire transaction and all subsequent transactions that were dependent on it.

So – what’s new in 7.4?

  • Selective tracking of transaction reads for improved transaction dependency tracking
  • Improved NDB Exceptions table format : Non-PK columns, operation type, transaction id, before and after values
  • Improved manageability: Online conflict role change, improved visibility into system state, operations, current and historic consistency

Configuring Active-Active Replication with Transactional Conflict Resolution

MySQL Replication Configuration

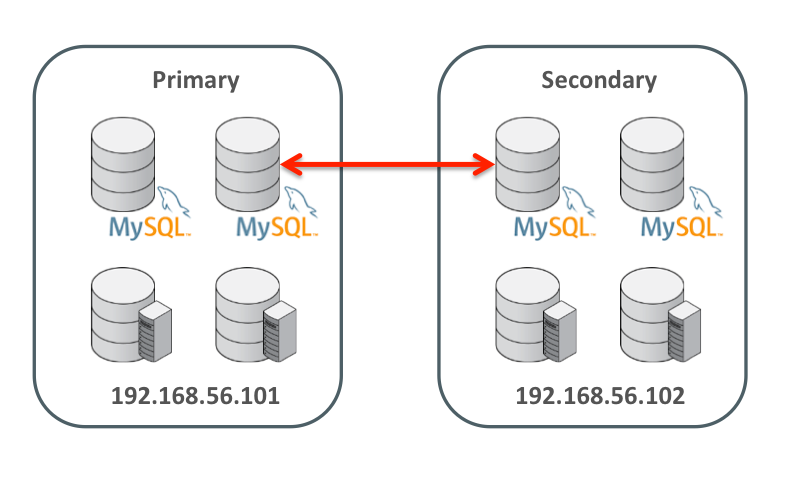
Figure 8: MySQL Replication Configuration

This section assumes that replication has already been set up between two clusters as shown in Figure 8. For more details on how to set up that configuration then refer to the blog: Enhanced conflict resolution with MySQL Cluster active-active replication.

To keep things simple, just two hosts are used; 192.168.56.101 contains all nodes for the primary cluster and 192.168.56.102 will contain all nodes for the secondary. A single MySQL Server in each cluster acts as both the master and the slave.

The first step is to identify the tables that need conflict detection enabling. Each of those tables then has to have an entry in the mysql.ndb_replication table where they’re tagged as using the new NDB$EPOCH2_TRANS() function – you could also choose to use NDB$EPOCH(), in which case only the changes to conflicting rows will be rolled-back rather than the full transactions. A few things to note:

  • This must be done before creating the application tables themselves
  • Should only be done on the primary
  • By default the table doesn’t exist and so the very first step is to create it
PRIMARY> CREATE TABLE mysql.ndb_replication (
->     db VARBINARY(63),
->     table_name VARBINARY(63),
->     server_id INT UNSIGNED,
->     binlog_type INT UNSIGNED,
->     conflict_fn VARBINARY(128),
->     PRIMARY KEY USING HASH (db, table_name, server_id)
-> )   ENGINE=NDB
-> PARTITION BY KEY(db,table_name);

PRIMARY> REPLACE INTO mysql.ndb_replication VALUES ('clusterdb', 'simple1', 0, 0,  'NDB$EPOCH2_TRANS()');
PRIMARY> REPLACE INTO mysql.ndb_replication VALUES ('clusterdb', 'simple2', 0, 0,'NDB$EPOCH2_TRANS()');
PRIMARY> REPLACE INTO mysql.ndb_replication VALUES ('clusterdb', 'simple3', 0, 0,'NDB$EPOCH2_TRANS()');

SECONDARY> SELECT * FROM mysql.ndb_replication;
+-----------+------------+-----------+-------------+--------------------+
| db        | table_name | server_id | binlog_type | conflict_fn        |
+-----------+------------+-----------+-------------+--------------------+
| clusterdb | simple2    |         0 |           0 | NDB$EPOCH2_TRANS() |
| clusterdb | simple1    |         0 |           0 | NDB$EPOCH2_TRANS() |
| clusterdb | simple3    |         0 |           0 | NDB$EPOCH2_TRANS() |
+-----------+------------+-----------+-------------+--------------------+

Refer to the MySQL Cluster documentation for details on the contents of the mysql.ndb_replication table.

The next step is to define which MySQL Cluster instance is to act as the PRIMARY and which as the SECONDARY (note that the slave SQL thread must be halted to make this change):

PRIMARY> STOP SLAVE SQL_THREAD;
SECONDARY> STOP SLAVE SQL_THREAD;
PRIMARY> SET GLOBAL ndb_slave_conflict_role='PRIMARY';
SECONDARY> SET GLOBAL ndb_slave_conflict_role='SECONDARY';
SECONDARY> START SLAVE SQL_THREAD;
PRIMARY> START SLAVE SQL_THREAD;

For each of these tables you should also create an exceptions table which will record any conflicts that have resulted in changes being rolled back; the format of these tables is rigidly defined and so take care to copy the types exactly; again this only needs doing on the primary:

PRIMARY> CREATE DATABASE clusterdb;USE clusterdb;

PRIMARY> CREATE TABLE simple1$EX (
NDB$server_id INT UNSIGNED,
NDB$master_server_id INT UNSIGNED,
NDB$master_epoch BIGINT UNSIGNED,
NDB$count INT UNSIGNED,
NDB$OP_TYPE ENUM('WRITE_ROW','UPDATE_ROW', 'DELETE_ROW', 'REFRESH_ROW', 'READ_ROW') NOT NULL,
NDB$CFT_CAUSE ENUM('ROW_DOES_NOT_EXIST', 'ROW_ALREADY_EXISTS', 'DATA_IN_CONFLICT', 'TRANS_IN_CONFLICT') NOT NULL,
NDB$ORIG_TRANSID BIGINT UNSIGNED NOT NULL,
id INT NOT NULL,
value$OLD INT,
value$NEW INT,
PRIMARY KEY(NDB$server_id, NDB$master_server_id, NDB$master_epoch, NDB$count)) ENGINE=NDB;

PRIMARY> CREATE TABLE simple2$EX (
NDB$server_id INT UNSIGNED,
NDB$master_server_id INT UNSIGNED,
NDB$master_epoch BIGINT UNSIGNED,
NDB$count INT UNSIGNED,
NDB$OP_TYPE ENUM('WRITE_ROW','UPDATE_ROW', 'DELETE_ROW', 'REFRESH_ROW', 'READ_ROW') NOT NULL,
NDB$CFT_CAUSE ENUM('ROW_DOES_NOT_EXIST', 'ROW_ALREADY_EXISTS', 'DATA_IN_CONFLICT', 'TRANS_IN_CONFLICT') NOT NULL,
NDB$ORIG_TRANSID BIGINT UNSIGNED NOT NULL,
id INT NOT NULL,
value$OLD INT,
value$NEW INT,
PRIMARY KEY(NDB$server_id, NDB$master_server_id, NDB$master_epoch, NDB$count)) ENGINE=NDB;

PRIMARY> CREATE TABLE simple3$EX (
NDB$server_id INT UNSIGNED,
NDB$master_server_id INT UNSIGNED,
NDB$master_epoch BIGINT UNSIGNED,
NDB$count INT UNSIGNED,
NDB$OP_TYPE ENUM('WRITE_ROW','UPDATE_ROW', 'DELETE_ROW', 'REFRESH_ROW', 'READ_ROW') NOT NULL,
NDB$CFT_CAUSE ENUM('ROW_DOES_NOT_EXIST', 'ROW_ALREADY_EXISTS', 'DATA_IN_CONFLICT', 'TRANS_IN_CONFLICT') NOT NULL,
NDB$ORIG_TRANSID BIGINT UNSIGNED NOT NULL,
id INT NOT NULL,
value$OLD INT,
value$NEW INT,
PRIMARY KEY(NDB$server_id, NDB$master_server_id, NDB$master_epoch, NDB$count)) ENGINE=NDB;

Refer to the MySQL Cluster documentation for details on the format of the exception tables.

Finally, the application tables themselves can be created (this only needs doing on the primary as they’ll be replicated to the secondary):

PRIMARY> CREATE TABLE simple1 (id INT NOT NULL PRIMARY KEY, value INT) ENGINE=ndb;
PRIMARY> CREATE TABLE simple2 (id INT NOT NULL PRIMARY KEY, value INT) ENGINE=ndb;
PRIMARY> CREATE TABLE simple3 (id INT NOT NULL PRIMARY KEY, value INT) ENGINE=ndb;

Everything is now set up and the new configuration can be tested to ensure that conflicts are detected and the correct updates are rolled back.

Testing Active-Active Replication with Transactional Conflict Resolution

The first step is to add some data to our new tables (note that at this point replication is running and so they only need to be created on the primary) and confirm that everything is replicated to the secondary:

PRIMARY> REPLACE INTO simple1 VALUES (1,10);
PRIMARY> REPLACE INTO simple2 VALUES (1,10);
PRIMARY> REPLACE INTO simple3 VALUES (1,10);

SECONDARY> SELECT * FROM simple1;
+----+-------+
| id | value |
+----+-------+
|  1 |    10 |
+----+-------+

SECONDARY> SELECT * FROM simple2;
+----+-------+
| id | value |
+----+-------+
|  1 |    10 |
+----+-------+

SECONDARY> SELECT * FROM simple3;
+----+-------+
| id | value |
+----+-------+
|  1 |    10 |
+----+-------+

It is important that the NDB$EPOCH2_TRANS() function rolls back any transactions on the secondary that involve a conflict (as well as subsequent, dependent transactions that modify the same rows); to intentionally trigger this, the simplest approach is to stop the slave IO thread on the secondary Cluster in order to increase the size of the window of conflict (which is otherwise very short). Once the slave IO thread has been stopped a change is made to table simple1 on the primary and then the secondary makes a (conflicting) change to the same row as well as making a change to table simple2 in the same transaction. A second transaction on the primary will change a row in simple3 – as it doesn’t touch any rows that have been involved in a conflict then that change should stand.

SECONDARY> STOP SLAVE IO_THREAD;

PRIMARY> UPDATE simple1 SET value=13 WHERE id=1;

SECONDARY> BEGIN; # conflicting transaction
SECONDARY> UPDATE simple1 SET value=20 WHERE id=1;
SECONDARY> UPDATE simple2 SET value=20 WHERE id=1;
SECONDARY> COMMIT;
SECONDARY> UPDATE simple3 SET value=20 WHERE id=1; # non conflicting

SECONDARY> SELECT * FROM simple1; SELECT * FROM simple2; SELECT * FROM simple3;
+----+-------+
| id | value |
+----+-------+
|  1 |    20 |
+----+-------+

+----+-------+
| id | value |
+----+-------+
|  1 |    20 |
+----+-------+

+----+-------+
| id | value |
+----+-------+
|  1 |    20 |
+----+-------+

If you now check the exception tables then you can see that the primary has received the changes from the secondary and because the first transaction updated the same row in simple1 during its window of conflict it has recorded that the change needs to be rolled back – this will happen as soon as the replication thread is restarted on the secondary:

PRIMARY> SELECT * FROM simple1$EX\G
*************************** 1. row ***************************
NDB$server_id: 9
NDB$master_server_id: 20
NDB$master_epoch: 31344671326216
NDB$count: 3
NDB$OP_TYPE: UPDATE_ROW
NDB$CFT_CAUSE: TRANS_IN_CONFLICT
NDB$ORIG_TRANSID: 193282978304
id: 1
value$OLD: 10
value$NEW: 20
1 row in set (0.00 sec)

PRIMARY> SELECT * FROM simple2$EX\G
*************************** 1. row ***************************
NDB$server_id: 9
NDB$master_server_id: 20
NDB$master_epoch: 31344671326216
NDB$count: 1
NDB$OP_TYPE: UPDATE_ROW
NDB$CFT_CAUSE: TRANS_IN_CONFLICT
NDB$ORIG_TRANSID: 193282978304
id: 1
value$OLD: 10
value$NEW: 20

PRIMARY> SELECT * FROM simple3$EX\G
Empty set (0.01 sec)

SECONDARY> START SLAVE IO_THREAD;

SECONDARY> SELECT * FROM simple1; SELECT * FROM simple2; SELECT * FROM simple3;
+----+-------+
| id | value |
+----+-------+
|  1 |    13 |
+----+-------+

+----+-------+
| id | value |
+----+-------+
|  1 |    10 |
+----+-------+

+----+-------+
| id | value |
+----+-------+
|  1 |    20 |
+----+-------+

These are the results we expect – simple1 has the value set by the primary with the subsequent change on the secondary rolled back; simple2 was not updated by the primary but the change on the secondary was rolled back as it was made in the same transaction as the conflicting update to simple1. The change on the secondary to simple3 has survived as it was made outside of any conflicting transaction and the change was not dependent on any conflicting changes. Finally just confirm that the data is identical on the primary:

PRIMARY> SELECT * FROM simple1; SELECT * FROM simple2; SELECT * FROM simple3;
+----+-------+
| id | value |
+----+-------+
|  1 |    13 |
+----+-------+

+----+-------+
| id | value |
+----+-------+
|  1 |    10 |
+----+-------+

+----+-------+
| id | value |
+----+-------+
|  1 |    20 |
+----+-------+

Statistics are provided on the primary that record that 1 conflict has been detected, effecting 1 transaction and that it resulted in 2 row changes being rolled back:

PRIMARY> SHOW STATUS LIKE 'ndb_conflict%';
+------------------------------------------+----------------+
| Variable_name                            | Value          |
+------------------------------------------+----------------+
| Ndb_conflict_fn_max                      | 0              |
| Ndb_conflict_fn_old                      | 0              |
| Ndb_conflict_fn_max_del_win              | 0              |
| Ndb_conflict_fn_epoch                    | 0              |
| Ndb_conflict_fn_epoch_trans              | 0              |
| Ndb_conflict_fn_epoch2                   | 0              |
| Ndb_conflict_fn_epoch2_trans             | 1              |
| Ndb_conflict_trans_row_conflict_count    | 1              |
| Ndb_conflict_trans_row_reject_count      | 2              |
| Ndb_conflict_trans_reject_count          | 1              |
| Ndb_conflict_trans_detect_iter_count     | 1              |
| Ndb_conflict_trans_conflict_commit_count | 1              |
| Ndb_conflict_epoch_delete_delete_count   | 0              |
| Ndb_conflict_reflected_op_prepare_count  | 0              |
| Ndb_conflict_reflected_op_discard_count  | 0              |
| Ndb_conflict_refresh_op_count            | 0              |
| Ndb_conflict_last_conflict_epoch         | 37391985278995 |
| Ndb_conflict_last_stable_epoch           | 37417755082760 |
+------------------------------------------+----------------+

SECONDARY> SHOW STATUS LIKE 'ndb_conflict%';
+------------------------------------------+----------------+
| Variable_name                            | Value          |
+------------------------------------------+----------------+
| Ndb_conflict_fn_max                      | 0              |
| Ndb_conflict_fn_old                      | 0              |
| Ndb_conflict_fn_max_del_win              | 0              |
| Ndb_conflict_fn_epoch                    | 0              |
| Ndb_conflict_fn_epoch_trans              | 0              |
| Ndb_conflict_fn_epoch2                   | 0              |
| Ndb_conflict_fn_epoch2_trans             | 0              |
| Ndb_conflict_trans_row_conflict_count    | 0              |
| Ndb_conflict_trans_row_reject_count      | 0              |
| Ndb_conflict_trans_reject_count          | 0              |
| Ndb_conflict_trans_detect_iter_count     | 0              |
| Ndb_conflict_trans_conflict_commit_count | 0              |
| Ndb_conflict_epoch_delete_delete_count   | 0              |
| Ndb_conflict_reflected_op_prepare_count  | 1              |
| Ndb_conflict_reflected_op_discard_count  | 1              |
| Ndb_conflict_refresh_op_count            | 2              |
| Ndb_conflict_last_conflict_epoch         | 32280974196749 |
| Ndb_conflict_last_stable_epoch           | 18897856102416 |
+------------------------------------------+----------------+

These status variables are described in the MySQL Cluster documentation.

Faster Restarts

You can restart MySQL Cluster processes (nodes) without losing database service (for example if adding extra memory to a server) and so on the face of it, the speed of the restarts isn’t that important. Having said that, while the node is restarting you’ve lost some of your high-availability which for super-critical applications can make you nervous. Additionally, faster restarts mean that you can complete maintenance activities faster – for example, a software upgrade requires a rolling restart of all of the nodes – if you have 48 data nodes then you want each of the data nodes to restart as quickly as possible.

MySQL 7.4 includes a number of optimisations to the restart code and so if you’re already using MySQL Cluster, it might be interesting to see how much faster it gets for your application.

Enhanced Reporting

MySQL Cluster presents a lot of monitoring information through the ndbinfo database and in 7.4 we’ve added some extra information on how memory is used for individual tables and how operations are distributed.

Extra Memory Reporting

MySQL Cluster allocates all of the required memory when a data node starts and so any information on memory usage from the operating system is of limited use and provides no clues as to how memory is used with the data nodes – for example, which tables are using the most memory. Also, as this is a distributed database, it is helpful to understand whether a particular table is using a similar amount of memory in each data node (if not then it could be that a better partitioning/sharding key could be used). Finally, when rows are deleted from a table, the memory for those rows would typically remain allocated against that table and so it is helpful to understand how many of these ‘empty slots’ are available for use by new rows in that table. MySQL Cluster 7.4 introduces a new table – ndbinfo.memory_per_fragment – that provides that information.

For example; to see how much memory is being used by each data node for a particular table…

mysql> CREATE DATABASE clusterdb;USE clusterdb;
mysql> CREATE TABLE simples (id INT NOT NULL AUTO_INCREMENT PRIMARY KEY) ENGINE=NDB;
mysql> SELECT node_id AS node, fragment_num AS frag, \
        fixed_elem_alloc_bytes alloc_bytes, \
        fixed_elem_free_bytes AS free_bytes, \
        fixed_elem_free_rows AS spare_rows \
        FROM ndbinfo.memory_per_fragment \
        WHERE fq_name LIKE '%simples%';
+------+------+-------------+------------+------------+
| node | frag | alloc_bytes | free_bytes | spare_rows |
+------+------+-------------+------------+------------+
|    1 |    0 |      131072 |       5504 |        172 |
|    1 |    2 |      131072 |       1280 |         40 |
|    2 |    0 |      131072 |       5504 |        172 |
|    2 |    2 |      131072 |       1280 |         40 |
|    3 |    1 |      131072 |       3104 |         97 |
|    3 |    3 |      131072 |       4256 |        133 |
|    4 |    1 |      131072 |       3104 |         97 |
|    4 |    3 |      131072 |       4256 |        133 |
+------+------+-------------+------------+------------+

When you delete rows from a MySQL Cluster table, the memory is not actually freed up and so if you check the existing memoryusage table you won’t see a change. This memory will be reused when you add new rows to that same table. In MySQL Cluster 7.4, it’s possible to see how much memory is in that state for a table…

mysql> SELECT node_id AS node, fragment_num AS frag, \
        fixed_elem_alloc_bytes alloc_bytes, \
        fixed_elem_free_bytes AS free_bytes, \
        fixed_elem_free_rows AS spare_rows \
        FROM ndbinfo.memory_per_fragment \
        WHERE fq_name LIKE '%simples%';
+------+------+-------------+------------+------------+
| node | frag | alloc_bytes | free_bytes | spare_rows |
+------+------+-------------+------------+------------+
|    1 |    0 |      131072 |       5504 |        172 |
|    1 |    2 |      131072 |       1280 |         40 |
|    2 |    0 |      131072 |       5504 |        172 |
|    2 |    2 |      131072 |       1280 |         40 |
|    3 |    1 |      131072 |       3104 |         97 |
|    3 |    3 |      131072 |       4256 |        133 |
|    4 |    1 |      131072 |       3104 |         97 |
|    4 |    3 |      131072 |       4256 |        133 |
+------+------+-------------+------------+------------+
mysql> DELETE FROM clusterdb.simples LIMIT 1;
mysql> SELECT node_id AS node, fragment_num AS frag, \
        fixed_elem_alloc_bytes alloc_bytes, \
        fixed_elem_free_bytes AS free_bytes, \
        fixed_elem_free_rows AS spare_rows \
        FROM ndbinfo.memory_per_fragment \
        WHERE fq_name LIKE '%simples%';
+------+------+-------------+------------+------------+
| node | frag | alloc_bytes | free_bytes | spare_rows |
+------+------+-------------+------------+------------+
|    1 |    0 |      131072 |       5504 |        172 |
|    1 |    2 |      131072 |       1312 |         41 |
|    2 |    0 |      131072 |       5504 |        172 |
|    2 |    2 |      131072 |       1312 |         41 |
|    3 |    1 |      131072 |       3104 |         97 |
|    3 |    3 |      131072 |       4288 |        134 |
|    4 |    1 |      131072 |       3104 |         97 |
|    4 |    3 |      131072 |       4288 |        134 |
+------+------+-------------+------------+------------+

As a final example, we can check whether a table is being evenly sharded accross the data nodes (in this case a realy bad sharding key was chosen)…

mysql> CREATE TABLE simples (id INT NOT NULL AUTO_INCREMENT, \
        species VARCHAR(20) DEFAULT "Human", 
        PRIMARY KEY(id, species)) engine=ndb PARTITION BY KEY(species);

// Add some data

mysql> SELECT node_id AS node, fragment_num AS frag, \
        fixed_elem_alloc_bytes alloc_bytes, \
        fixed_elem_free_bytes AS free_bytes, \
        fixed_elem_free_rows AS spare_rows \
        FROM ndbinfo.memory_per_fragment \
        WHERE fq_name LIKE '%simples%';
+------+------+-------------+------------+------------+
| node | frag | alloc_bytes | free_bytes | spare_rows |
+------+------+-------------+------------+------------+
|    1 |    0 |           0 |          0 |          0 |
|    1 |    2 |      196608 |      11732 |        419 |
|    2 |    0 |           0 |          0 |          0 |
|    2 |    2 |      196608 |      11732 |        419 |
|    3 |    1 |           0 |          0 |          0 |
|    3 |    3 |           0 |          0 |          0 |
|    4 |    1 |           0 |          0 |          0 |
|    4 |    3 |           0 |          0 |          0 |
+------+------+-------------+------------+------------+

Extra Operations Reporting

To ensure that resources are being used effectively, it is very helpful to understand the how each table is being access (how frequently and for what types of operations). To support this, the ndbinfo. operations_per_fragment table is provided. For example, the data in this table would let you identify that a large number of full table scans are performed on a particular table.

It is also important to identify if there are any hotspots where a disproportionate share of the queries for a table are hitting a particular fragment/data node. Again, ndbinfo. operations_per_fragment provides this information.

As an example of how to use some of the data from this table, a simple table is created and populated and then ndbinfo.operations_per_fragment is used to monitor how many Primary Key reads and table scans are performed[1]:

mysql> CREATE TABLE simples (id INT AUTO_INCREMENT PRIMARY KEY, time TIMESTAMP) ENGINE=NDB;

mysql> SELECT fq_name AS 'Table', node_id AS 'Data Node', tot_key_reads AS 'Reads', tot_frag_scans AS 'Scans' FROM ndbinfo.operations_per_fragment WHERE fq_name LIKE '%simples';
+-----------------------+-----------+-------+-------+
| Table                 | Data Node | Reads | Scans |
+-----------------------+-----------+-------+-------+
| clusterdb/def/simples |         3 |     0 |     1 |
| clusterdb/def/simples |         3 |     0 |     0 |
| clusterdb/def/simples |         4 |     0 |     0 |
| clusterdb/def/simples |         4 |     0 |     1 |
+-----------------------+-----------+-------+-------+

mysql> REPLACE INTO simples VALUES ();  # Repeated several times
mysql> SELECT * FROM simples;
+----+---------------------+
| id | time                |
+----+---------------------+
|  7 | 2015-01-22 15:12:42 |
…
|  8 | 2015-01-22 15:12:58 |
+----+---------------------+
23 rows in set (0.00 sec)

mysql> SELECT fq_name AS 'Table', node_id AS 'Data Node', tot_key_reads AS 'Reads', tot_frag_scans AS 'Scans' FROM ndbinfo.operations_per_fragment WHERE fq_name LIKE '%simples';
+-----------------------+-----------+-------+-------+
| Table                 | Data Node | Reads | Scans |
+-----------------------+-----------+-------+-------+
| clusterdb/def/simples |         3 |     0 |     2 |
| clusterdb/def/simples |         3 |     0 |     0 |
| clusterdb/def/simples |         4 |     0 |     0 |
| clusterdb/def/simples |         4 |     0 |     2 |
+-----------------------+-----------+-------+-------+

mysql> SELECT * FROM simples WHERE id=11;
+----+---------------------+
| id | time                |
+----+---------------------+
| 11 | 2015-01-22 15:12:59 |
+----+---------------------+

mysql> SELECT fq_name AS 'Table', node_id AS 'Data Node', tot_key_reads AS 'Reads', tot_frag_scans AS 'Scans' FROM ndbinfo.operations_per_fragment WHERE fq_name LIKE '%simples';
+-----------------------+-----------+-------+-------+
| Table                 | Data Node | Reads | Scans |
+-----------------------+-----------+-------+-------+
| clusterdb/def/simples |         3 |     0 |     2 |
| clusterdb/def/simples |         3 |     0 |     0 |
| clusterdb/def/simples |         4 |     0 |     0 |
| clusterdb/def/simples |         4 |     1 |     2 |
+-----------------------+-----------+-------+-------+

Note that there are two rows listed for each data node but only one row for each has non-zero values; this is because each data node holds the primary fragment for one of the partitions and the secondary fragment for the other – all operations are performed only on the active fragments. This is made clearer if the fragment number is included in the query:

mysql> SELECT fq_name AS 'Table', node_id AS 'Data Node', fragment_num AS 'Fragment', tot_key_reads AS 'Reads', tot_frag_scans AS 'Scans' FROM ndbinfo.operations_per_fragment WHERE fq_name LIKE '%simples';
+-----------------------+-----------+----------+-------+-------+
| Table                 | Data Node | Fragment | Reads | Scans |
+-----------------------+-----------+----------+-------+-------+
| clusterdb/def/simples |         3 |        0 |     0 |     2 |
| clusterdb/def/simples |         3 |        1 |     0 |     0 |
| clusterdb/def/simples |         4 |        0 |     0 |     0 |
| clusterdb/def/simples |         4 |        1 |     1 |     2 |
+-----------------------+-----------+----------+-------+-------+

Conclusion

We’re really excited about the GA for this new MySQL Cluster release; if you get chance to try it out then please let us know how you get on – either through a comment on this blog, a MySQL bug report or a post to the MySQL Cluster Forum.


MySQL Cluster 7.4.3 RELEASE CANDIDATE now available

MySQL Cluster Logo

Oracle have just made availble the Release Candidate for MySQL Cluster 7.4 (MySQL Cluster 7.4.3) – it can be downloaded from the development release tab here. Note that this is not a GA release and so we wouldn’t recommend using it in production.

The delta between this RC and the 7.4.2 DMR can be viewed in the MySQL Cluster 7.4.3 Release Notes

There are three main focus areas for this RC and the purpose of this post is to briefly introduce them:

  • Active-Active (Multi-Master) Replication
  • Performance
  • Operational improvements (speeding up of restarts; enhanced memory reporting)

Active-Active (Multi-Master) Replication

MySQL Cluster allows bi-directional replication between two (or more) clusters. Replication within each cluster is synchronous but between clusters it is asynchronous which means the following scenario is possible:

Conflict with asynchronous replication
Site A Replication Site B
x == 10 x == 10
x = 11 x = 20
— x=11 –> x == 11
x==20 <– x=20 —


In this example a value (column for a row in a table) is set to 11 on site A and the change is queued for replication to site B. In the mean time, an application sets the value to 20 on site B and that change is queued for replication to site A. Once both sites have received and applied the replicated change from the other cluster site A contains the value 20 while site B contains 11 – in other words the databases are now inconsistent.

How MySQL Cluster implements eventual consistency

There are two phases to establishing consistency between both clusters after an inconsistency has been introduced:

  1. Detect that a conflict has happened
  2. Resolve the inconsistency

The following animation illustrates how MySQL Cluster 7.2 detects that an inconsistency has been introduced by the asynchronous, active-active replication:

Detecting conflicts

While we typically consider the 2 clusters in an active-active replication configuration to be peers, in this case we designate one to be the primary and the other the secondary. Reads and writes can still be sent to either cluster but it is the responsibility of the primary to identify that a conflict has arisen and then remove the inconsistency.

A logical clock is used to identify (in relative terms) when a change is made on the primary – for those who know something of the MySQL Cluster internals, we use the index of the Global Checkpoint that the update is contained in. For all tables that have this feature turned on, an extra, hidden column is automatically added on the primary – this represents the value of the logical clock when the change was made.

Once the change has been applied on the primary, there is a “window of conflict” for the effected row(s) during which if a different change is made to the same row(s) on the secondary then there will be an inconsistency. Once the slave on the secondary has applied the change from the primary, it will send a replication event back to the slave on the primary, containing the primary’s clock value associated with the changes that have just been applied on the secondary. (Remember that the clock is actually the Global Checkpoint Index and so this feature is sometimes referred to as Reflected GCI). Once the slave on the primary has received this event, it knows that all changes tagged with a clock value no later than the reflected GCI are now safe – the window of conflict has closed.

If an application modifies this same row on the secondary before the replication event from the primary was applied then it will send an associated replication event to the slave on the primary before it reflects the new GCI. The slave on the primary will process this replication event and compare the clock value recorded with the effected rows with the latest reflected GCI; as the clock value for the conflicting row is higher the primary recognises that a conflict has occured and will launch the algorithm to resolve the inconsistency.

Options for MySQL Cluster replication conflict detection/resolution

After a conflict has been detected, you have the option of having the database simply report the conflict to the application or have it roll back just the conflicting row or the entire transaction and all subsequent transactions that were dependent on it.

So – what’s new in 7.4?

  • Detects conflicts between inserts and updates
  • Option to roll back entire transaction (and dependent transactions) rather than just the conflicting row
  • All conflicts are handled before switching primary – avoiding potential race conditions

Performance

MySQL CLuster Read-Write Performance
Being a scaled-out, in-memory, real-time database, MySQL Cluster performance has always been great but we continue to work on making it faster each release. In particular, we want to keep pace with the trend of having more and more cores rather than faster ones. 7.4 continues along the path of better exploiting multiple cores – as can be seen from these benchmark results.
MySQL CLuster 7.4 Read Performance
Just make sure that you’re using the multi-threaded data node (ndbmtd rather than ndbd) and have configured how many threads it should use.

Faster Restarts

You can restart MySQL Cluster processes (nodes) without losing database service (for example if adding extra memory to a server) and so on the face of it, the speed of the restarts isn’t that important. Having said that, while the node is restarting you’ve lost some of your high-availability which for super-critical applications can make you nervous. Additionally, faster restarts mean that you can complete maintenance activities faster – for example, a software upgrade requires a rolling restart of all of the nodes – if you have 48 data nodes then you want each of the data nodes to restart as quickly as possible.

MySQL 7.4 includes a number of optimisations to the restart code and so if you’re already using MySQL Cluster, it might be interesting to see how much faster it gets for your application. We also have some extra optimisations in the works that you can expect to see in later 7.4 versions.

Extra Memory Reporting

MySQL Cluster presents a lot of monitoring information through the ndbinfo database and in 7.4 we’ve added some extra information on how memory is used for individual tables.

For example; to see how much memory is being used by each data node for a particular table…

mysql> CREATE DATABASE clusterdb;USE clusterdb;
mysql> CREATE TABLE simples (id INT NOT NULL AUTO_INCREMENT PRIMARY KEY) ENGINE=NDB;
mysql> SELECT node_id AS node, fragment_num AS frag, \
        fixed_elem_alloc_bytes alloc_bytes, \
        fixed_elem_free_bytes AS free_bytes, \
        fixed_elem_free_rows AS spare_rows \
        FROM ndbinfo.memory_per_fragment \
        WHERE fq_name LIKE '%simples%';
+------+------+-------------+------------+------------+
| node | frag | alloc_bytes | free_bytes | spare_rows |
+------+------+-------------+------------+------------+
|    1 |    0 |      131072 |       5504 |        172 |
|    1 |    2 |      131072 |       1280 |         40 |
|    2 |    0 |      131072 |       5504 |        172 |
|    2 |    2 |      131072 |       1280 |         40 |
|    3 |    1 |      131072 |       3104 |         97 |
|    3 |    3 |      131072 |       4256 |        133 |
|    4 |    1 |      131072 |       3104 |         97 |
|    4 |    3 |      131072 |       4256 |        133 |
+------+------+-------------+------------+------------+

When you delete rows from a MySQL Cluster table, the memory is not actually freed up and so if you check the existing memoryusage table you won’t see a change. This memory will be reused when you add new rows to that same table. In MySQL Cluster 7.4, it’s possible to see how much memory is in that state for a table…

mysql> SELECT node_id AS node, fragment_num AS frag, \
        fixed_elem_alloc_bytes alloc_bytes, \
        fixed_elem_free_bytes AS free_bytes, \
        fixed_elem_free_rows AS spare_rows \
        FROM ndbinfo.memory_per_fragment \
        WHERE fq_name LIKE '%simples%';
+------+------+-------------+------------+------------+
| node | frag | alloc_bytes | free_bytes | spare_rows |
+------+------+-------------+------------+------------+
|    1 |    0 |      131072 |       5504 |        172 |
|    1 |    2 |      131072 |       1280 |         40 |
|    2 |    0 |      131072 |       5504 |        172 |
|    2 |    2 |      131072 |       1280 |         40 |
|    3 |    1 |      131072 |       3104 |         97 |
|    3 |    3 |      131072 |       4256 |        133 |
|    4 |    1 |      131072 |       3104 |         97 |
|    4 |    3 |      131072 |       4256 |        133 |
+------+------+-------------+------------+------------+
mysql> DELETE FROM clusterdb.simples LIMIT 1;
mysql> SELECT node_id AS node, fragment_num AS frag, \
        fixed_elem_alloc_bytes alloc_bytes, \
        fixed_elem_free_bytes AS free_bytes, \
        fixed_elem_free_rows AS spare_rows \
        FROM ndbinfo.memory_per_fragment \
        WHERE fq_name LIKE '%simples%';
+------+------+-------------+------------+------------+
| node | frag | alloc_bytes | free_bytes | spare_rows |
+------+------+-------------+------------+------------+
|    1 |    0 |      131072 |       5504 |        172 |
|    1 |    2 |      131072 |       1312 |         41 |
|    2 |    0 |      131072 |       5504 |        172 |
|    2 |    2 |      131072 |       1312 |         41 |
|    3 |    1 |      131072 |       3104 |         97 |
|    3 |    3 |      131072 |       4288 |        134 |
|    4 |    1 |      131072 |       3104 |         97 |
|    4 |    3 |      131072 |       4288 |        134 |
+------+------+-------------+------------+------------+

As a final example, we can check whether a table is being evenly sharded accross the data nodes (in this case a realy bad sharding key was chosen)…

mysql> CREATE TABLE simples (id INT NOT NULL AUTO_INCREMENT, \
        species VARCHAR(20) DEFAULT "Human", 
        PRIMARY KEY(id, species)) engine=ndb PARTITION BY KEY(species);

// Add some data

mysql> SELECT node_id AS node, fragment_num AS frag, \
        fixed_elem_alloc_bytes alloc_bytes, \
        fixed_elem_free_bytes AS free_bytes, \
        fixed_elem_free_rows AS spare_rows \
        FROM ndbinfo.memory_per_fragment \
        WHERE fq_name LIKE '%simples%';
+------+------+-------------+------------+------------+
| node | frag | alloc_bytes | free_bytes | spare_rows |
+------+------+-------------+------------+------------+
|    1 |    0 |           0 |          0 |          0 |
|    1 |    2 |      196608 |      11732 |        419 |
|    2 |    0 |           0 |          0 |          0 |
|    2 |    2 |      196608 |      11732 |        419 |
|    3 |    1 |           0 |          0 |          0 |
|    3 |    3 |           0 |          0 |          0 |
|    4 |    1 |           0 |          0 |          0 |
|    4 |    3 |           0 |          0 |          0 |
+------+------+-------------+------------+------------+

If you get chance to try out this new release then please let us know how you get on – either through a comment on this blog, a MySQL bug report or a post to the MySQL Cluster Forum.


Active-Active Replication, Performance Improvements & Operational Enhancements – some of what’s available in the new MySQL Cluster 7.4.2 DMR

MySQL Cluster Logo

Oracle have just made availble the new MySQL Cluster 7.4.2 Development Milestone Release – it can be downloaded from the development release tab here. Note that this is not a GA release and so we wouldn’t recommend using it in production.

This is the second DMR for MySQL 7.4; the delta between this DMR and 7.4.1 can be viewed in the MySQL Cluster 7.4.2 Release Notes

There are three main focus areas for this DMR and the purpose of this post is to briefly introduce them:

  • Active-Active (Multi-Master) Replication
  • Performance
  • Operational improvements (speeding up of restarts; enhanced memory reporting)

Active-Active (Multi-Master) Replication

MySQL Cluster allows bi-directional replication between two (or more) clusters. Replication within each cluster is synchronous but between clusters it is asynchronous which means the following scenario is possible:

Conflict with asynchronous replication
Site A Replication Site B
x == 10 x == 10
x = 11 x = 20
— x=11 –> x == 11
x==20 <– x=20 —


In this example a value (column for a row in a table) is set to 11 on site A and the change is queued for replication to site B. In the mean time, an application sets the value to 20 on site B and that change is queued for replication to site A. Once both sites have received and applied the replicated change from the other cluster site A contains the value 20 while site B contains 11 – in other words the databases are now inconsistent.

How MySQL Cluster implements eventual consistency

There are two phases to establishing consistency between both clusters after an inconsistency has been introduced:

  1. Detect that a conflict has happened
  2. Resolve the inconsistency

The following animation illustrates how MySQL Cluster 7.2 detects that an inconsistency has been introduced by the asynchronous, active-active replication:

Detecting conflicts

While we typically consider the 2 clusters in an active-active replication configuration to be peers, in this case we designate one to be the primary and the other the secondary. Reads and writes can still be sent to either cluster but it is the responsibility of the primary to identify that a conflict has arisen and then remove the inconsistency.

A logical clock is used to identify (in relative terms) when a change is made on the primary – for those who know something of the MySQL Cluster internals, we use the index of the Global Checkpoint that the update is contained in. For all tables that have this feature turned on, an extra, hidden column is automatically added on the primary – this represents the value of the logical clock when the change was made.

Once the change has been applied on the primary, there is a “window of conflict” for the effected row(s) during which if a different change is made to the same row(s) on the secondary then there will be an inconsistency. Once the slave on the secondary has applied the change from the primary, it will send a replication event back to the slave on the primary, containing the primary’s clock value associated with the changes that have just been applied on the secondary. (Remember that the clock is actually the Global Checkpoint Index and so this feature is sometimes referred to as Reflected GCI). Once the slave on the primary has received this event, it knows that all changes tagged with a clock value no later than the reflected GCI are now safe – the window of conflict has closed.

If an application modifies this same row on the secondary before the replication event from the primary was applied then it will send an associated replication event to the slave on the primary before it reflects the new GCI. The slave on the primary will process this replication event and compare the clock value recorded with the effected rows with the latest reflected GCI; as the clock value for the conflicting row is higher the primary recognises that a conflict has occured and will launch the algorithm to resolve the inconsistency.

Options for MySQL Cluster replication conflict detection/resolution

After a conflict has been detected, you have the option of having the database simply report the conflict to the application or have it roll back just the conflicting row or the entire transaction and all subsequent transactions that were dependent on it.

So – what’s new in 7.4.1?

  • Detects conflicts between inserts and updates
  • Option to roll back entire transaction (and dependent transactions) rather than just the conflicting row
  • All conflicts are handled before switching primary – avoiding potential race conditions

As mentioned at the start of this post, this is pre-GA and there are some extra enhancements we plan on including in the final version:

  • Handle deletes which conflict with other operations
  • Roll back transactions that have read a row that had been rolled back due to a conflict

Performance

MySQL CLuster 7.4.1 Read-Write Performance
Being a scaled-out, in-memory, real-time database, MySQL Cluster performance has always been great but we continue to work on making it faster each release. In particular, we want to keep pace with the trend of having more and more cores rather than faster ones. 7.4 continues along the path of better exploiting multiple cores – as can be seen from these benchmark results.
MySQL CLuster 7.4.1 Read Performance
Just make sure that you’re using the multi-threaded data node (ndbmtd rather than ndbd) and have configured how many threads it should use.

Faster Restarts

You can restart MySQL Cluster processes (nodes) without losing database service (for example if adding extra memory to a server) and so on the face of it, the speed of the restarts isn’t that important. Having said that, while the node is restarting you’ve lost some of your high-availability which for super-critical applications can make you nervous. Additionally, faster restarts mean that you can complete maintenance activities faster – for example, a software upgrade requires a rolling restart of all of the nodes – if you have 48 data nodes then you want each of the data nodes to restart as quickly as possible.

MySQL 7.4.1 includes a number of optimisations to the restart code and so if you’re already using MySQL Cluster, it might be interesting to see how much faster it gets for your application. We also have some extra optimisations in the works that you can expect to see in later 7.4 versions.

Extra Memory Reporting

MySQL Cluster presents a lot of monitoring information through the ndbinfo database and in 7.4 we’ve added some extra information on how memory is used for individual tables.

For example; to see how much memory is being used by each data node for a particular table…

mysql> CREATE DATABASE clusterdb;USE clusterdb;
mysql> CREATE TABLE simples (id INT NOT NULL AUTO_INCREMENT PRIMARY KEY) ENGINE=NDB;
mysql> SELECT node_id AS node, fragment_num AS frag, \
        fixed_elem_alloc_bytes alloc_bytes, \
        fixed_elem_free_bytes AS free_bytes, \
        fixed_elem_free_rows AS spare_rows \
        FROM ndbinfo.memory_per_fragment \
        WHERE fq_name LIKE '%simples%';
+------+------+-------------+------------+------------+
| node | frag | alloc_bytes | free_bytes | spare_rows |
+------+------+-------------+------------+------------+
|    1 |    0 |      131072 |       5504 |        172 |
|    1 |    2 |      131072 |       1280 |         40 |
|    2 |    0 |      131072 |       5504 |        172 |
|    2 |    2 |      131072 |       1280 |         40 |
|    3 |    1 |      131072 |       3104 |         97 |
|    3 |    3 |      131072 |       4256 |        133 |
|    4 |    1 |      131072 |       3104 |         97 |
|    4 |    3 |      131072 |       4256 |        133 |
+------+------+-------------+------------+------------+

When you delete rows from a MySQL Cluster table, the memory is not actually freed up and so if you check the existing memoryusage table you won’t see a change. This memory will be reused when you add new rows to that same table. In MySQL Cluster 7.4, it’s possible to see how much memory is in that state for a table…

mysql> SELECT node_id AS node, fragment_num AS frag, \
        fixed_elem_alloc_bytes alloc_bytes, \
        fixed_elem_free_bytes AS free_bytes, \
        fixed_elem_free_rows AS spare_rows \
        FROM ndbinfo.memory_per_fragment \
        WHERE fq_name LIKE '%simples%';
+------+------+-------------+------------+------------+
| node | frag | alloc_bytes | free_bytes | spare_rows |
+------+------+-------------+------------+------------+
|    1 |    0 |      131072 |       5504 |        172 |
|    1 |    2 |      131072 |       1280 |         40 |
|    2 |    0 |      131072 |       5504 |        172 |
|    2 |    2 |      131072 |       1280 |         40 |
|    3 |    1 |      131072 |       3104 |         97 |
|    3 |    3 |      131072 |       4256 |        133 |
|    4 |    1 |      131072 |       3104 |         97 |
|    4 |    3 |      131072 |       4256 |        133 |
+------+------+-------------+------------+------------+
mysql> DELETE FROM clusterdb.simples LIMIT 1;
mysql> SELECT node_id AS node, fragment_num AS frag, \
        fixed_elem_alloc_bytes alloc_bytes, \
        fixed_elem_free_bytes AS free_bytes, \
        fixed_elem_free_rows AS spare_rows \
        FROM ndbinfo.memory_per_fragment \
        WHERE fq_name LIKE '%simples%';
+------+------+-------------+------------+------------+
| node | frag | alloc_bytes | free_bytes | spare_rows |
+------+------+-------------+------------+------------+
|    1 |    0 |      131072 |       5504 |        172 |
|    1 |    2 |      131072 |       1312 |         41 |
|    2 |    0 |      131072 |       5504 |        172 |
|    2 |    2 |      131072 |       1312 |         41 |
|    3 |    1 |      131072 |       3104 |         97 |
|    3 |    3 |      131072 |       4288 |        134 |
|    4 |    1 |      131072 |       3104 |         97 |
|    4 |    3 |      131072 |       4288 |        134 |
+------+------+-------------+------------+------------+

As a final example, we can check whether a table is being evenly sharded accross the data nodes (in this case a realy bad sharding key was chosen)…

mysql> CREATE TABLE simples (id INT NOT NULL AUTO_INCREMENT, \
        species VARCHAR(20) DEFAULT "Human", 
        PRIMARY KEY(id, species)) engine=ndb PARTITION BY KEY(species);

// Add some data

mysql> SELECT node_id AS node, fragment_num AS frag, \
        fixed_elem_alloc_bytes alloc_bytes, \
        fixed_elem_free_bytes AS free_bytes, \
        fixed_elem_free_rows AS spare_rows \
        FROM ndbinfo.memory_per_fragment \
        WHERE fq_name LIKE '%simples%';
+------+------+-------------+------------+------------+
| node | frag | alloc_bytes | free_bytes | spare_rows |
+------+------+-------------+------------+------------+
|    1 |    0 |           0 |          0 |          0 |
|    1 |    2 |      196608 |      11732 |        419 |
|    2 |    0 |           0 |          0 |          0 |
|    2 |    2 |      196608 |      11732 |        419 |
|    3 |    1 |           0 |          0 |          0 |
|    3 |    3 |           0 |          0 |          0 |
|    4 |    1 |           0 |          0 |          0 |
|    4 |    3 |           0 |          0 |          0 |
+------+------+-------------+------------+------------+

If you get chance to try out this new release then please let us know how you get on – either through a comment on this blog, a MySQL bug report or a post to the MySQL Cluster Forum.


Active-Active Replication, Performance Improvements & Operational Enhancements – some of what’s available in the new MySQL Cluster 7.4.1 DMR

MySQL Cluster Logo

Oracle have just made availble the new MySQL Cluster 7.4.1 Development Milestone Release – it can be downloaded from the development release tab here. Note that this is not a GA release and so we wouldn’t recommend using it in production.

There are three main focus areas for this DMR and the purpose of this post is to briefly introduce them:

  • Active-Active (Multi-Master) Replication
  • Performance
  • Operational improvements (speeding up of restarts; enhanced memory reporting)

Active-Active (Multi-Master) Replication

MySQL Cluster allows bi-directional replication between two (or more) clusters. Replication within each cluster is synchronous but between clusters it is asynchronous which means the following scenario is possible:

Conflict with asynchronous replication
Site A Replication Site B
x == 10 x == 10
x = 11 x = 20
— x=11 –> x == 11
x==20 <– x=20 —


In this example a value (column for a row in a table) is set to 11 on site A and the change is queued for replication to site B. In the mean time, an application sets the value to 20 on site B and that change is queued for replication to site A. Once both sites have received and applied the replicated change from the other cluster site A contains the value 20 while site B contains 11 – in other words the databases are now inconsistent.

How MySQL Cluster implements eventual consistency

There are two phases to establishing consistency between both clusters after an inconsistency has been introduced:

  1. Detect that a conflict has happened
  2. Resolve the inconsistency

The following animation illustrates how MySQL Cluster 7.2 detects that an inconsistency has been introduced by the asynchronous, active-active replication:

Detecting conflicts

While we typically consider the 2 clusters in an active-active replication configuration to be peers, in this case we designate one to be the primary and the other the secondary. Reads and writes can still be sent to either cluster but it is the responsibility of the primary to identify that a conflict has arisen and then remove the inconsistency.

A logical clock is used to identify (in relative terms) when a change is made on the primary – for those who know something of the MySQL Cluster internals, we use the index of the Global Checkpoint that the update is contained in. For all tables that have this feature turned on, an extra, hidden column is automatically added on the primary – this represents the value of the logical clock when the change was made.

Once the change has been applied on the primary, there is a “window of conflict” for the effected row(s) during which if a different change is made to the same row(s) on the secondary then there will be an inconsistency. Once the slave on the secondary has applied the change from the primary, it will send a replication event back to the slave on the primary, containing the primary’s clock value associated with the changes that have just been applied on the secondary. (Remember that the clock is actually the Global Checkpoint Index and so this feature is sometimes referred to as Reflected GCI). Once the slave on the primary has received this event, it knows that all changes tagged with a clock value no later than the reflected GCI are now safe – the window of conflict has closed.

If an application modifies this same row on the secondary before the replication event from the primary was applied then it will send an associated replication event to the slave on the primary before it reflects the new GCI. The slave on the primary will process this replication event and compare the clock value recorded with the effected rows with the latest reflected GCI; as the clock value for the conflicting row is higher the primary recognises that a conflict has occured and will launch the algorithm to resolve the inconsistency.

Options for MySQL Cluster replication conflict detection/resolution

After a conflict has been detected, you have the option of having the database simply report the conflict to the application or have it roll back just the conflicting row or the entire transaction and all subsequent transactions that were dependent on it.

So – what’s new in 7.4.1?

  • Detects conflicts between inserts and updates
  • Option to roll back entire transaction (and dependent transactions) rather than just the conflicting row
  • All conflicts are handled before switching primary – avoiding potential race conditions

As mentioned at the start of this post, this is pre-GA and there are some extra enhancements we plan on including in the final version:

  • Handle deletes which conflict with other operations
  • Roll back transactions that have read a row that had been rolled back due to a conflict

Performance

MySQL CLuster 7.4.1 Read-Write Performance
Being a scaled-out, in-memory, real-time database, MySQL Cluster performance has always been great but we continue to work on making it faster each release. In particular, we want to keep pace with the trend of having more and more cores rather than faster ones. 7.4 continues along the path of better exploiting multiple cores – as can be seen from these benchmark results.
MySQL CLuster 7.4.1 Read Performance
Just make sure that you’re using the multi-threaded data node (ndbmtd rather than ndbd) and have configured how many threads it should use.

Faster Restarts

You can restart MySQL Cluster processes (nodes) without losing database service (for example if adding extra memory to a server) and so on the face of it, the speed of the restarts isn’t that important. Having said that, while the node is restarting you’ve lost some of your high-availability which for super-critical applications can make you nervous. Additionally, faster restarts mean that you can complete maintenance activities faster – for example, a software upgrade requires a rolling restart of all of the nodes – if you have 48 data nodes then you want each of the data nodes to restart as quickly as possible.

MySQL 7.4.1 includes a number of optimisations to the restart code and so if you’re already using MySQL Cluster, it might be interesting to see how much faster it gets for your application. We also have some extra optimisations in the works that you can expect to see in later 7.4 versions.

Extra Memory Reporting

MySQL Cluster presents a lot of monitoring information through the ndbinfo database and in 7.4 we’ve added some extra information on how memory is used for individual tables.

For example; to see how much memory is being used by each data node for a particular table…

mysql> CREATE DATABASE clusterdb;USE clusterdb;
mysql> CREATE TABLE simples (id INT NOT NULL AUTO_INCREMENT PRIMARY KEY) ENGINE=NDB;
mysql> SELECT node_id AS node, fragment_num AS frag, \
        fixed_elem_alloc_bytes alloc_bytes, \
        fixed_elem_free_bytes AS free_bytes, \
        fixed_elem_free_rows AS spare_rows \
        FROM ndbinfo.memory_per_fragment \
        WHERE fq_name LIKE '%simples%';
+------+------+-------------+------------+------------+
| node | frag | alloc_bytes | free_bytes | spare_rows |
+------+------+-------------+------------+------------+
|    1 |    0 |      131072 |       5504 |        172 |
|    1 |    2 |      131072 |       1280 |         40 |
|    2 |    0 |      131072 |       5504 |        172 |
|    2 |    2 |      131072 |       1280 |         40 |
|    3 |    1 |      131072 |       3104 |         97 |
|    3 |    3 |      131072 |       4256 |        133 |
|    4 |    1 |      131072 |       3104 |         97 |
|    4 |    3 |      131072 |       4256 |        133 |
+------+------+-------------+------------+------------+

When you delete rows from a MySQL Cluster table, the memory is not actually freed up and so if you check the existing memoryusage table you won’t see a change. This memory will be reused when you add new rows to that same table. In MySQL Cluster 7.4, it’s possible to see how much memory is in that state for a table…

mysql> SELECT node_id AS node, fragment_num AS frag, \
        fixed_elem_alloc_bytes alloc_bytes, \
        fixed_elem_free_bytes AS free_bytes, \
        fixed_elem_free_rows AS spare_rows \
        FROM ndbinfo.memory_per_fragment \
        WHERE fq_name LIKE '%simples%';
+------+------+-------------+------------+------------+
| node | frag | alloc_bytes | free_bytes | spare_rows |
+------+------+-------------+------------+------------+
|    1 |    0 |      131072 |       5504 |        172 |
|    1 |    2 |      131072 |       1280 |         40 |
|    2 |    0 |      131072 |       5504 |        172 |
|    2 |    2 |      131072 |       1280 |         40 |
|    3 |    1 |      131072 |       3104 |         97 |
|    3 |    3 |      131072 |       4256 |        133 |
|    4 |    1 |      131072 |       3104 |         97 |
|    4 |    3 |      131072 |       4256 |        133 |
+------+------+-------------+------------+------------+
mysql> DELETE FROM clusterdb.simples LIMIT 1;
mysql> SELECT node_id AS node, fragment_num AS frag, \
        fixed_elem_alloc_bytes alloc_bytes, \
        fixed_elem_free_bytes AS free_bytes, \
        fixed_elem_free_rows AS spare_rows \
        FROM ndbinfo.memory_per_fragment \
        WHERE fq_name LIKE '%simples%';
+------+------+-------------+------------+------------+
| node | frag | alloc_bytes | free_bytes | spare_rows |
+------+------+-------------+------------+------------+
|    1 |    0 |      131072 |       5504 |        172 |
|    1 |    2 |      131072 |       1312 |         41 |
|    2 |    0 |      131072 |       5504 |        172 |
|    2 |    2 |      131072 |       1312 |         41 |
|    3 |    1 |      131072 |       3104 |         97 |
|    3 |    3 |      131072 |       4288 |        134 |
|    4 |    1 |      131072 |       3104 |         97 |
|    4 |    3 |      131072 |       4288 |        134 |
+------+------+-------------+------------+------------+

As a final example, we can check whether a table is being evenly sharded accross the data nodes (in this case a realy bad sharding key was chosen)…

mysql> CREATE TABLE simples (id INT NOT NULL AUTO_INCREMENT, \
        species VARCHAR(20) DEFAULT "Human", 
        PRIMARY KEY(id, species)) engine=ndb PARTITION BY KEY(species);

// Add some data

mysql> SELECT node_id AS node, fragment_num AS frag, \
        fixed_elem_alloc_bytes alloc_bytes, \
        fixed_elem_free_bytes AS free_bytes, \
        fixed_elem_free_rows AS spare_rows \
        FROM ndbinfo.memory_per_fragment \
        WHERE fq_name LIKE '%simples%';
+------+------+-------------+------------+------------+
| node | frag | alloc_bytes | free_bytes | spare_rows |
+------+------+-------------+------------+------------+
|    1 |    0 |           0 |          0 |          0 |
|    1 |    2 |      196608 |      11732 |        419 |
|    2 |    0 |           0 |          0 |          0 |
|    2 |    2 |      196608 |      11732 |        419 |
|    3 |    1 |           0 |          0 |          0 |
|    3 |    3 |           0 |          0 |          0 |
|    4 |    1 |           0 |          0 |          0 |
|    4 |    3 |           0 |          0 |          0 |
+------+------+-------------+------------+------------+

If you get chance to try out this new release then please let us know how you get on – either through a comment on this blog, a MySQL bug report or a post to the MySQL Cluster Forum.


I’ll be presenting at Oracle OpenWorld next week

I'm speaking at MySQL Central @ Oracle OpenWorld 2014
I will be presenting two sessions at MySQL Central @ Oracle OpenWorld in San Francisco next Thursday (2nd Ocotber). I hope to see as many of you there as possible and I’ll be around after the session to continue answering any questions.

NoSQL and SQL: The Best of Both Worlds [CON2853]

There’s a lot of excitement about NoSQL data stores, with the promise of simple access patterns, flexible schemas, scalability, and high availability. The downside comes in the form of losing ACID transactions, consistency, flexible queries, and data integrity checks. What if you could have the best of both worlds? This session shows how MySQL Cluster provides simultaneous SQL and native NoSQL access to your data—whether it’s in a simple key-value API (memcached) or REST, JavaScript, Java, or C++. You will hear how the MySQL Cluster architecture delivers in-memory real-time performance; 99.999 percent availability; online maintenance; and linear, horizontal scalability through transparent autosharding.

MySQL Cluster: Dive into the Latest Developments [CON3815]

MySQL Cluster is the distributed, shared-nothing version of MySQL. It’s typically used for applications that need any combination of high availability, real-time performance, and scaling of reads and writes. After a brief introduction to the technology, its uses, and the new features added in MySQL Cluster 7.3, this session focuses on the very latest developments happening in MySQL Cluster 7.4. As you’d expect from a real-time, scalable, distributed, in-memory database, performance continues to be a top priority, as do simplicity of use and robustness. Come hear firsthand what’s being done to make sure MySQL Cluster continues to dominate in mission-critical, high-performance applications.